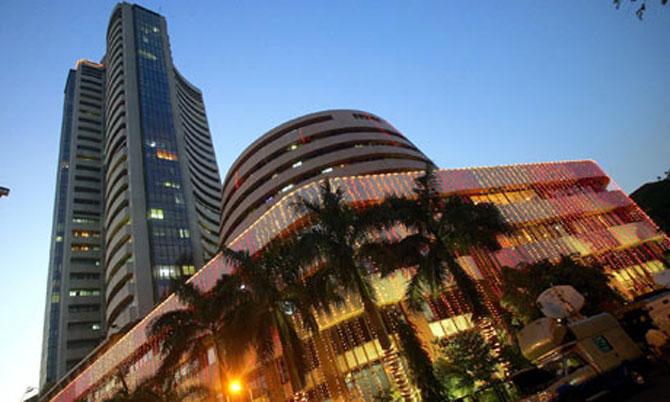
The BSE Sensex is at an all-time high and most analysts believe the recent rally is the beginning of a new bull-run on Dalal Street.
In the past 15 years, the Street has seen three similar rallies -- the dot-com rally in 1999-2000, called the big bull-run from late 2003 to early 2008, and one in 2009, during a recovery from the crisis triggered by the collapse of the Lehman Brothers in 2008.
Is the current Indian market akin to the one in 1998-99, the second half of 2003, or early 2009?
In the past 17 years (the period for which data on quarterly growth in gross domestic product, or gross domestic product, is available), India has seen five deep economic downturns, including the current slowdown, as well as a shallow cut in 2004-05.
. . .

On a relative basis, the current slowdown is similar to the ones in 1997-98, 2000-01 and 2002-03, but more severe than the growth dip after the Lehman crisis.
Besides, the current downturn seems to be more resilient.
In the past, growth declined sharply for three-four quarters, and rebounded the following year, in a V-shaped recovery.
The current growth trajectory is following an L-curve -- growth has been sub-six per cent for 10 quarters.
The stock market, however, seems to have its own trajectory, which is somewhat disconnected to economic growth.
. . .

In the past, Sensex valuations (price-to-earnings multiple, on a 12-month trailing basis) fell sharply, in line with economic growth and, subsequently, bounced back.
In contrast, the benchmark is currently trading at a three-year high of 19 times (quarterly average of 18.2) the underlying earnings of its constituent stocks.
This is much higher than the price/earnings (P/E) multiples in previous downturns.
The dot-com rally started with a P/E multiple of 11; it was 13.7 in the June 2003 quarter and 12.6 in the March 2009 quarter.
The current valuation is similar to that on the eve of the corrections in early 2004 and the second halves of 2006 and 2011.
. . .

Historically, the Sensex P/E multiple has been 2.5-3 times the GDP growth in the previous four quarters.
Now, the multiple has shot up to 3.8.
This can be justified only if GDP growth accelerates to 6.5 per cent in the next four quarters.
Otherwise, there are reasons to believe the Indian stock market has been re-rated by foreign investors and there has been P/E rise of about 40 per cent.
That is, the same earnings now have 40 per cent higher valuation than in the early 90s and early 2000s, due to benign global liquidity conditions.
If that is the case, the Sensex could rally sharply, even without high GDP growth, but fall equally fast if global monetary conditions change, a risky bet on economic recovery in India.