rediff.com
News APP

NewsApp (Free)

Read news as it happens
Download NewsApp

Available on  gplay

Rediff.com  » Business » Economic indicators: How India, China, Pak compare
This article was first published 13 years ago

Economic indicators: How India, China, Pak compare

Last updated on: April 29, 2011 09:06 IST

Image: Geo-strategic power is turning upside down.
Photographs: Reuters

Lately, there has been a lot of talk about whether China will replace the United States as the economic powerhouse, whether India will overtake China and whether Pakistan is a failed economic state.

While there is no doubt that the United States remains the sole superpower, China -- based on current statistics -- is fast catching up with the US. India, however, has a long way to go.

So, let's see where India, Pakistan, China and the United States stand on socio-economic indicators.

...

Economic indicators: How India, China, Pak compare

Image: India has a higher GDP than Pakistan.
Photographs: Reuters
India: GDP per capita $1,296.68

Pakistan: GDP per capita $1,074.08

China: GDP per capita $4,763.87

United States: GDP per capita $48,387.29

...

Economic indicators: How India, China, Pak compare

Image: Pakistan has the lowest GDP.
Photographs: Reuters
India: GDP $1,598.39 billion

Pakistan: GDP $190.204 billion

China: GDP $6,422.28 billion

United States: GDP $15,157.29 billion

...
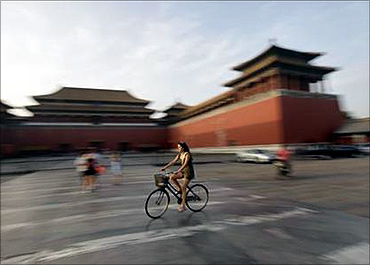
Economic indicators: How India, China, Pak compare

Image: China saw the fastest GDP growth.
Photographs: Reuters
India: GDP growth 8.37%

Pakistan: GDP growth 2.75%

China: GDP growth 9.58%

United States: GDP growth 2.01%

...

Economic indicators: How India, China, Pak compare

Image: US and India have high unemployment rates.
Photographs: Reuters
India: Unemployment rate 9.5%

Pakistan: Unemployment rate 6.1%

China: Unemployment rate 4%

United States: Unemployment rate 9.5%

...

Economic indicators: How India, China, Pak compare

Image: India's inflation rate is above 8 per cent.
Photographs: Reuters
India: Inflation rate 8.3%

Pakistan: Inflation rate 12.91%

China: Inflation rate 5%

United States: Inflation rate 2.7%

...

Economic indicators: How India, China, Pak compare

Image: Pakistan is way behind in attracting FDI.
Photographs: Reuters
India: Foreign Direct Investment $17 billion

Pakistan: Foreign Direct Investment $1.08 billion

China: Foreign Direct Investment $12.52 billion

United States: Foreign Direct Investment $194.5 billion

...

Economic indicators: How India, China, Pak compare

Image: China is way ahead in foreign reserves.
Photographs: Reuters
India: Reserves of foreign exchange and gold $308 billion

Pakistan: Reserves of foreign exchange and gold $15.6 billion

China: Reserves of foreign exchange and gold $3.0 trillion

United States: Reserves of foreign exchange and gold $77 billion

...

Economic indicators: How India, China, Pak compare

Image: US has a whopping 15 trillion debt.
Photographs: Reuters
India: External debt $297.5 billion

Pakistan: External debt $58.40 billion

China: External debt $549 billion

United States: External debt $15 trillion

...

Economic indicators: How India, China, Pak compare

Image: India is not far behind China in population.
Photographs: Reuters
India: Population 1.23 billion

Pakistan: Population 169.38 million

China: Population 1.37 billion

United States: Population 313.24 million

...
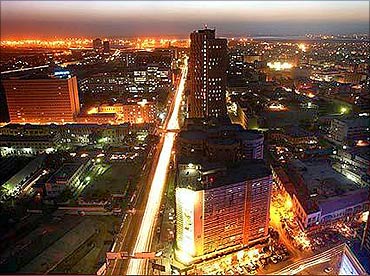
Economic indicators: How India, China, Pak compare

Image: Pakistan has the highest growth rate.
Photographs: Reuters
India: Population growth rate 1.40%

Pakistan: Population growth rate 1.55%

China: Population growth rate 0.65%

United States: Population growth rate 0.97%

...
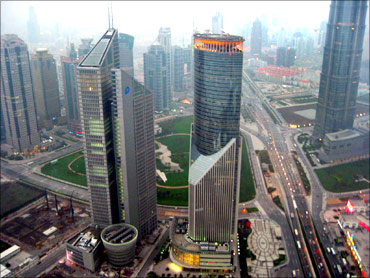
Economic indicators: How India, China, Pak compare

Image: China has the lowest death rate.
Photographs: Reuters
India: Death rate 7.6 deaths/1,000 population

Pakistan: Death rate 7.21 deaths/1,000 population

China: Death rate 7.06 deaths/1,000 population

United States: Death rate 8.38 deaths/1,000 population

...

Economic indicators: How India, China, Pak compare

Image: US leads in life expectancy.
Photographs: Reuters
India: Life expectancy at birth 66.09 years

Pakistan: Life expectancy at birth 65.26 years

China: Life expectancy at birth 73.47 years

United States: Life expectancy at birth 78.11 years

...

Economic indicators: How India, China, Pak compare

Image: Infant mortality rate in India is high.
Photographs: Reuters
India: Infant mortality rate 30.15 deaths/1,000 live births

Pakistan: Infant mortality rate 67.36 deaths/1,000 live births

China: Infant mortality rate 20.25 deaths/1,000 live births

United States: Infant mortality rate 6.22 deaths/1,000 live births

...

Economic indicators: How India, China, Pak compare

Image: China has the lowest fertility rate.
Photographs: Reuters
India: Fertility rate 2.68 children born/woman

Pakistan: Fertility rate 3.43 children born/woman

China: Fertility rate 1.79 children born/woman

United States: Fertility rate 2.05 children born/woman