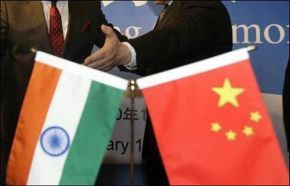
China is growing at a faster pace than India and scores on key macroeconomic ratios. But India Inc beats its Chinese counterpart hands down in key financial ratios.
 Indian companies are not only more profitable than their Chinese peers but offer more bang for the buck to their shareholders.
India’s top companies, excluding banking and financial ones, earned 14.3 per cent on their net worth (shareholders’ equity) in 2012-13, higher than the 10.2 per cent reported by Chinese companies. At 15.6 per cent, operating margins were also much higher than the 11.4 per cent reported by Chinese firms last year.
The analysis is based on the combined figures for companies (excluding banking & financial ones) on the BSE 200 and the Shanghai SSE 180 indices.
The Indian sample has 157 companies while the Chinese sample has 150.
On an average, Chinese companies are more leveraged. As of the year ended December 2012, the latest period for which data are available, these companies had a debt-to-equity ratio of 1.5 --higher than Indian firms’ ratio of one in 2012-13.
A typical Chinese company (based on median value) had a debt-to-equity ratio of 1.1, compared with an Indian firm’s 0.6.
Analysts attribute this to aggressive investment by Chinese companies, especially after the 2008 Lehman crisis, when Chinese banks expanded bank credit to avoid an economic slowdown. “Return ratios fall when capital expenditure runs ahead of demand growth. Chinese companies have aggressively expanded their capacity across sectors over the past few years but their capacity utilisation has declined, with demand growth slowing after the Lehman crisis,” says Dalton Capital Advisors Managing Director U R Bhat.
The problem of excess capacity is visible in low asset turnover ratio of Chinese firms. On an average, a Chinese company in the sample produced USD 87 worth of revenue for every USD 100 of assets.
The corresponding number for Indian companies was $100. This was partly due to a greater concentration of real estate companies in the SEE 180 index.
The index includes 29 real estate developers, against three on the BSE 200 index.
Chinese real estate developers generated just $40 billion worth of revenues for every $100 billion of assets during the year ended December 2012.
At the end of 2012, the 150 Chinese companies in the sample were sitting on total debt of $1,262 billion (based on the current dollar-renminbi exchange rate), backed by USD 2,105 billion worth of assets and combined revenues and net profit of $1,831 billion and $85 billion, respectively.
However unlike Indian firms, only about half their total debt (USD 602 billion) was traditional long-term and short-term borrowing.
Indian companies ended 2012-13 with a combined gross debt of $245 billion (at the current exchange rate), supported by $523 billion worth of assets. It led to $645 billion worth of revenues and around $40 billion worth of net profits in 2012-13.
Nearly 87 per cent of the debt on Indian companies’ books is traditional long-term and short-term borrowing, while the rest are other liabilities like deferred tax liability.
Indian companies have higher market capitalisation for every unit of assets and borrowings.
On an average, Chinese companies’ market capitalisation is 1.5 times their total debt. The corresponding ratio for Indian companies, based on their balance sheet for 2012-13, is 2.5 times.
At 86 per cent, the median value of market cap-to-debt ratio is even worse for Chinese companies, compared with Indian companies’ 644 per cent.
According to analysts, this is due to a lack of service sector companies in China. “India has more service companies, such as information technology and healthcare ones, which always trade at a premium to the overall market.
In contrast, the Chinese market is dominated by manufacturing companies, which have seen a decline in valuation ratios over the past few years,” says KR Choksey Shares and Securities CEO Deven Choksey.
The SEE 180 Index is currently trading at 12.6 times its underlying earnings in the past 12 months, against 18.3 times for the BSE 200.
However, to be fair to Chinese firms, they have a higher borrowing capacity, thanks to much lower interest rates than in India. On an average, Chinese companies’ interest cost was 3.6 per cent in calendar year 2012, against 6.1 per cent for Indian companies in 2012-13.
This enabled Chinese firms to spend a lower portion of their operating profit on debt servicing than their Indian counterparts. In 2012, Chinese companies spent just 10 per cent of their operating profit on interest payment, compared with Indian companies’ 16 per cent.
Experts attribute this to a higher savings rate in China (nearly 50 per of GDP), against around 30 per cent in India, coupled with a highly regulated banking sector that offers very low interest on savings deposit.
This a recipe for investment, especially in low-yielding assets like real estate and infrastructure, which could become a liability if the economy grows at a slower pace and the world’s leading central banks continue to tighten their monetary policy, as planned. India Inc is better placed to weather that monetary storm than China Inc.


