The impact of economic slump was visible in the Budget’s fine print, as this step-by-step explanation show how the Budget math was worked out, reports Abhishek Waghmare.

Finance minister Nirmala Sitharaman presented an ambitious Budget for 2020-21 last weekend, but the impact of economic slump was visible in the fine print. Let us see through this, step-by-step, to understand how the Budget math was worked out.
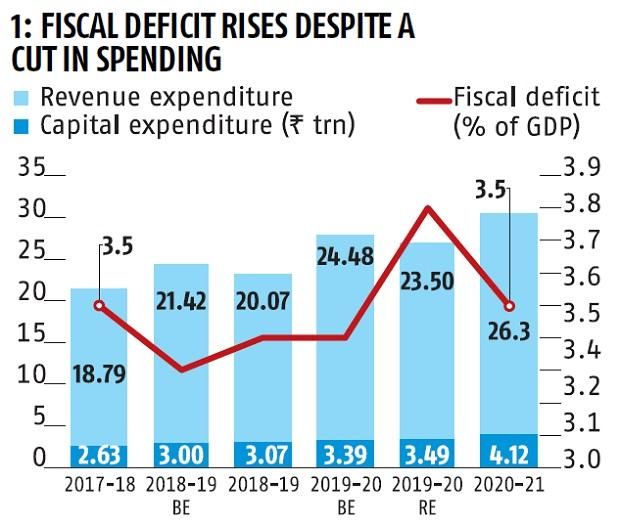
The overall spending in 2019-20 was curtailed by nearly Rs 90,000 crore in comparison to the expected spending. This happened despite the fact that fiscal deficit was raised from 3.3 per cent of gross domestic product (GDP) to 3.8 per cent, showing that deficit widened during a fiscal contraction, a big worry (Chart 1).
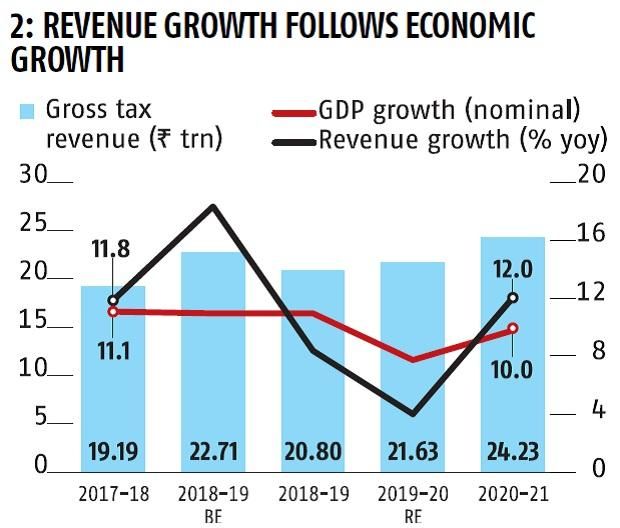
Slowdown in economic growth has taken a clear toll on revenue growth, as Chart 2 shows. But the government expects economic activity to pick up in FY21, and push revenue growth up, too.
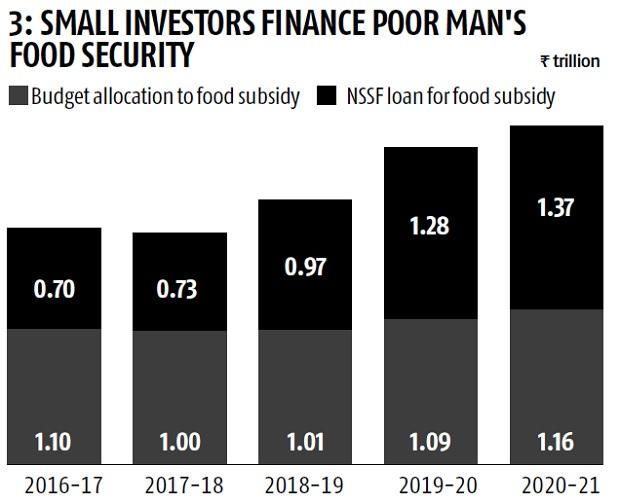
The externalities of this are severe. For instance, cheaper food for the poor would be increasingly financed from investments made by small savers, as government is unable to spend from its coffers (Chart 3).
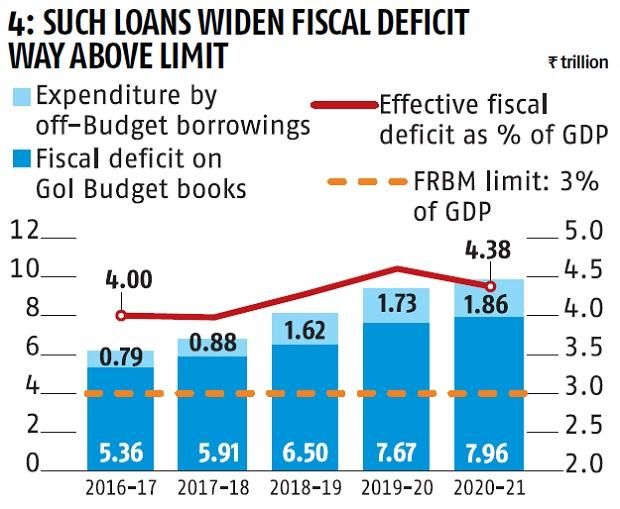
Such financing by tapping into the National Small Savings Fund would take the real fiscal deficit close to 4.4 per cent of GDP (Chart 4).
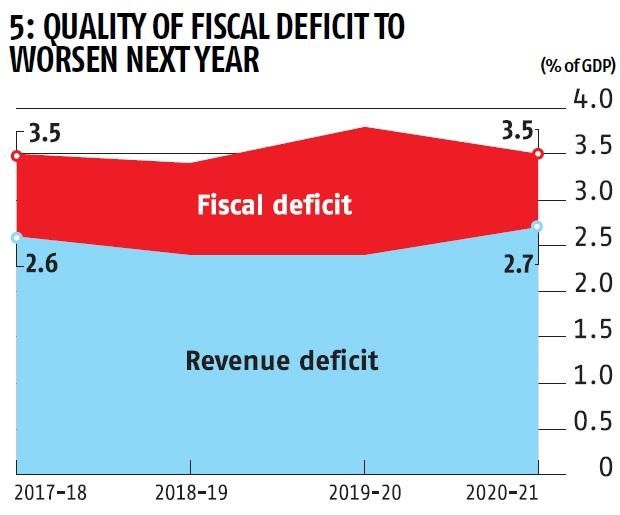
A bigger worry, however, is the nature of the fiscal deficit. In FY21, a bigger part of the fiscal deficit will be used to fund revenue expenses such as welfare schemes, salaries and pensions, interest payments (Chart 5).
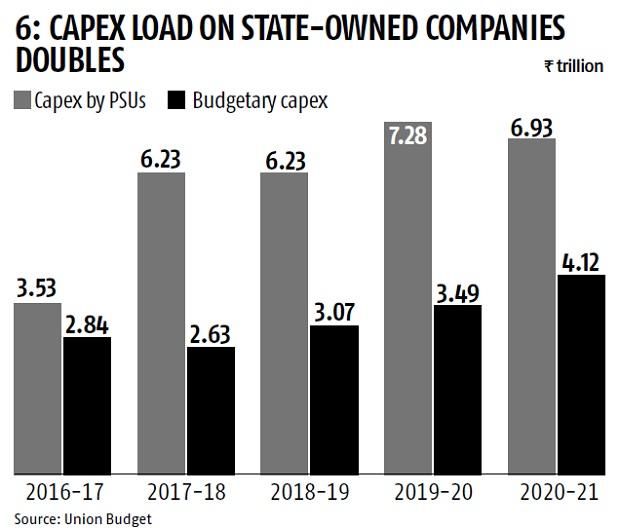
Capex is rising, but its load is being taken up by public enterprises in the last few years, so much that the latter has fast outpaced the former (Chart 6).
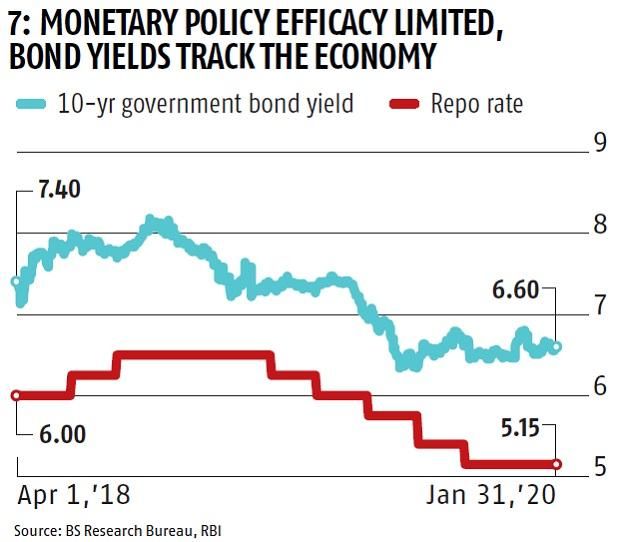
The uncertainty about budgetary spending, widening of deficit, and ambiguity on growth uptick would weigh on February’s monetary policy decision. But a bigger worry is bond yields remaining stubborn, or worse, rising (Chart 7).
StatsGuru is a weekly feature. Every Monday, Business Standard guides you through the numbers you need to know to make sense of the headlines.


