American markets continued to make new highs in the past week with S&P500 now standing at 1485. There is nothing on the oscillator charts to suggest buying exhaustion. The wave counts favour an extension of the rally to the third week of February. Nevertheless, it is time for caution and selective profit booking. Start by taking out the garbage in the portfolio. Then take a look at weaklings that significantly under-performed the market since March of 2009.
What follows in the US will be an orderly 10 to 20 per cent correction in values that will present significant buying opportunities. But you need to create cash in the portfolio to be able to do so.
NASDAQ too continues in an uptrend with no sign of buying exhaustion. Individual market leaders within the technology sector like IBM and Google are nearing the end of their corrections. Their rallies from lows could fuel NASDAQ further.
Asian markets like Nikkei and Shanghai continue making new highs but off their recent all-time lows. Both have a long way to go, albeit with corrections on the way. NIFTY is a halfway house between the Asian giants and the US/EU markets. It has completed a major correction but is again approaching all-time highs. It remains to be seen if NIFTY will follow the Asians or the US lead. However, barring a retest of 5950 again, NIFTY too shows no weakness as yet.
Enjoy the ride but avoid getting greedy. Disciplined profit-taking is a must to survive in the treacherous markets ahead.
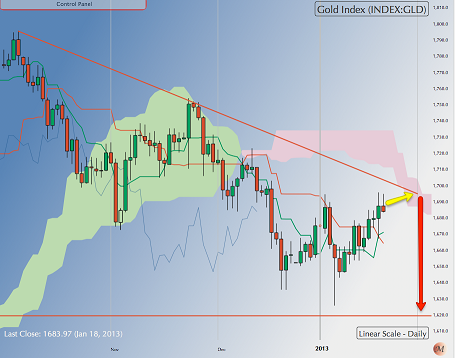 Gold: Gold closed the week at $1687, just a notch below its 50 DMA but well above its 200 DMA. This has been one of the longest corrections in gold barring the bear market of 1979 to 2001. Yes, gold too has long bear phases!
There is no sign that the correction in gold has ended in terms of time or wave counts. Gold has been trending up with other risk assets and could test the upper bounds of the trading channel, even making it to the $1750/1800 price area. Or it could drift tamely to the $1550 area. Whichever the trajectory, expect gold to retest $1550 before this correction is over.
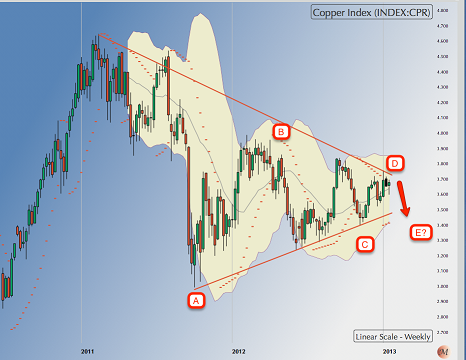 Copper: There is no change in the copper chart from last week. The metal closed last week at 3.6790.
Copper is more closely aligned with price trends in industrial metals than gold or other commodities. It is positioned at the fag end of an intermediate correction that may have already ended or will end soon.
Watch for a price break above 3.8. That will confirm that Copper has ended a one-year correction and is now poised to explore higher territory towards 4.60. As always wait for a decisive break above 3.80.
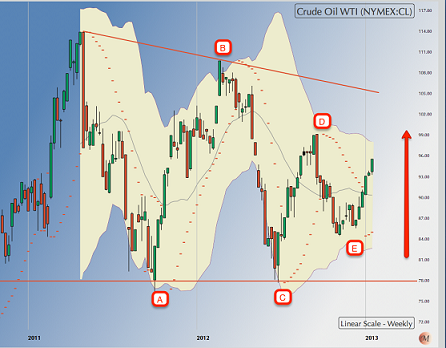 WTI Crude: WTI crude closed the week at $95.56, well above both its 200 and 50 DMAs. The 50 DMA is poised to give a buy signal over the next two or three weeks.
As shown in the weekly chart above, WTI crude could have ended a two-year correction at point "E" and is now in a new uptrend. A break above $100 will confirm a new bullish trend in crude.
Watch for a decisive break above $100 over the next few weeks.
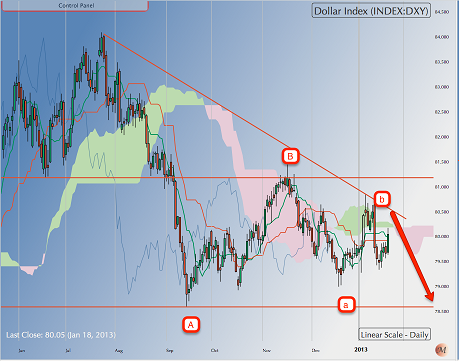 US Dollar Index [DXY]: The Dollar Index closed the week at 80.11. The sharp rally at the close of the week was likely reactive and the DXY will likely resume its downtrend next week with a target of 79.
The bullish correction in the Dollar has room to run both in terms of price and time. A cheaper Dollar is basically fuelling the rise in all asset classes. A termination of the correction in the Dollar will also likely terminate the rally in equities and other risk assets.
So the Dollar continues
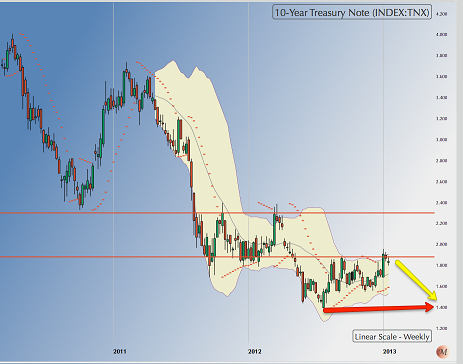 10-year T-Note yields: Yield on 10-year Treasury notes ended the week at 1.85 pc after having spiked up to 1.95 pc last week. Yields are at all-time lows never seen before.
Yields may drift down to 1.80 pc before retesting the 1.95 pc area. The first sign of a turnaround in the interest rate cycle and the consequent money rotation from bond to equities would likely emerge here once yields move decisively above 2 pc.
Unwinding the bubble in bond markets will not be painless. But it might put a floor under equities and commodities. Watch this space.
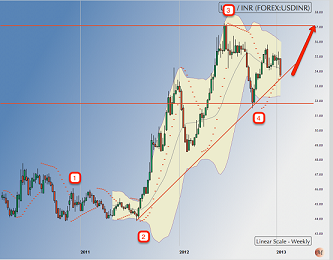 USD-INR: The currency wars, fuelled by bouts of debasement in the US dollar, euro and now yen, continued unabated. They are likely to get more intense before things get better and the losers will be countries that have no choice but to let their home currency appreciate because they need to borrow. India is one such likely loser.
The USD-INR closed the week at INR 53.73, almost on the up-sloping trend line in the chart above. That leaves hope that RBI will read the currency wars right and let the USD appreciate against the home currency.
A fall below INR 53 in the Dollar will negate my wave count. At the very least, expect a pull-back to INR 54.50 region.
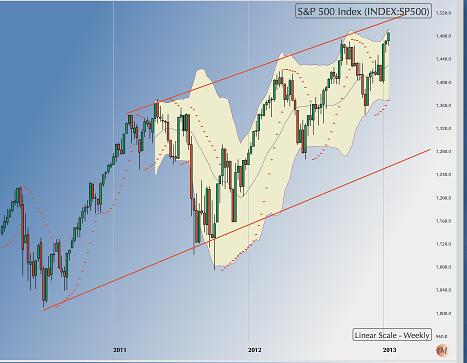 S&P 500 [SPX]: The above is a weekly chart of the latest leg of the rally in the SPX to lend perspective to the discussion. SPX closed the week at 1486, a new high.
Oscillatory charts show no buying exhaustion or negative divergences. In term of time, this leg can continue making new highs until the third week of February. Could SPX make a new all-time high?
Anything is possible, including an abrupt early termination to the rally. As such use very tight, sliding, stop loss orders to protect your profits. And use the opportunity to clean out your portfolio of all ugly ducklings. Junk the accumulated cats & dogs.
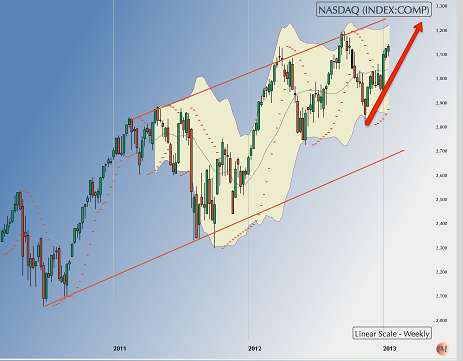 NASDAQ Composite: NASDAQ closed the week at 3135, well below its recent highs of 3200. Much like SPX, NASDAQ too could make a new high above 3200 or try to match that level.
The Index has time to run into the third week of February and quite a few large stocks that are close to ending significant corrections. The Index may well surprise with the steam left.
Same caveats as SPX apply. Use tight stop losses to protect profits and clean out the garbage in the portfolio to generate cash to buy in subsequent correction.
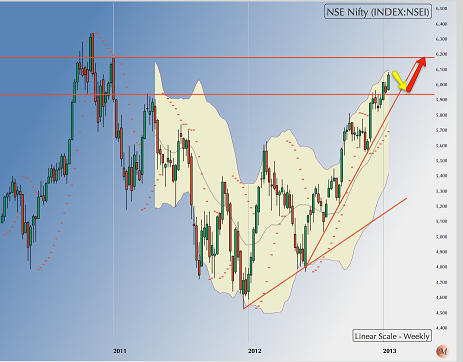 NIFTY: NIFTY closed the week at 6064.
The Index could come down to retest 5950 again early next week. If the level holds again, the case for an extension to the rally becomes stronger.
It is too early to tell how NIFTY will react to a possible correction in the US markets towards the end of February. Next logical target for the NIFTY remains 6325, provided 5950 continues to hold in the next correction.
Take the garbage out. Generate some cash and use tight stop losses to protect profits. Don't assume NIFTY can continue to rally if global markets correct, though it may.
NB: These notes are just personal musings on the world market trends as a sort of reminder to me on what I thought of them at a particular point in time. They are not predictions and none should rely on them for any investment decisions.
Sonali Ranade is a trader in the international markets


