Setting bear traps is the common tactic to extend rallies at tops because bulls don’t have to use their own cash to fuel such rallies, says Sonali Ranade
Topping is a process that takes time, its contours dependent on the exact technical position of bulls and bears and their cash flows. Bulls will push the rally as long as they can distribute while eager bears look for similar opportunities to go short. Setting bear traps is the common tactic to extend rallies at tops because bulls don’t have to use their own cash to fuel such rallies.
Further down, I have briefly laid out the bear traps in the NASDAQ 100 and the Russell 2000 space. The tech sector has a host of stocks [I am an Apple bull with a position picked up in the current meltdown] such as MSFT, IBM, APPL, AMZN, INTC that have been correcting for months and are still at their lows or have just broken away from them. Hence there is fuel for an extension to this rally. Likewise, the midcap space has as usual attracted cash at the top, an unfortunate phenomenon that never changes.
Note, this rally is now targeting those critters that turned up their nose at equities and were very bullish on commodities, especially oil and precious metals thinking a currency debasement that got out of hand was inevitable. This has been one of the most enduring investment themes for the last four years and had legions of adherents. Well, the markets are challenging these investors by simultaneously tanking commodities while rallying equities. All this is accompanied by a rising dollar that used to be negatively correlated to US equities. It’s not an easy time for the doom and gloom crowd, especially those that didn’t watch their cash flow carefully.
It is not my case that the doom and gloom crowd were wrong. Far from it. My case is that their assumptions and conviction are being tested. And those that got too greedy will be slaughtered to fuel this rally.
 |
US Dollar [DXY]: The US Dollar index, DXY, closed the week at 82.72. The index is in a very strong uptrend and is in the process of consolidating around the 82 mark before taking out its next overhead resistance at 83.
Retain my view that DXY is destined to make a higher high than 84.25 before a meaningful correction sets in to this rally. Note, the 50 DMA is inching towards a bullish cross over its 200 DMA which is currently at 81,
|
| |
 |
EURUSD: The EURUSD closed the week at 1.3003. Retain my view that the euro is correcting for its rally from 1.20 to 1.37 and a 50 per cent correction implies a target of 1.2850 that’s not too far off.
Incidentally, the EURUSD 200 DMA is also currently in the 1.2850 region and we can expect a bounce from there. A more solid floor exists at 1.27 in case 1.2850 is taken out -- which is likely.
|
| |
 |
USDJPY: The USDJPY closed the week at 96.03 piercing through its important overhead resistance at 95. This opens the way for a test of 101 in the near future. There is nothing on the charts to show that the rally in the $ is anywhere near its end in the yen market. The $ successfully tested its support at 50 DMA at 91 during the week. Expect some consolidation over 95 before the $ rallies rolls on towards 101.
|
| |
 |
USDINR: The USDINR closed the week at 54.35. $-INR illustrates a classic example of triangulation by markets when they don’t know which way to go. The last rally to 55.13 represented the point D in the triangulation and the $-INR headed for a test of 53.50 which is point E. Expect a rally in the $-INR from the region of 53 to 55 followed by a retest of the all time high of 57.25. Note, point E is usually not achieved as markets can rally short of the mark.
|
| |
 |
Gold: Gold closed the week at $1578. Gold is nearing its make or break point. If it is to test 1525, it must do so over the next week or two or rally from here. Odds are high that 1525 will not hold. Expect a few days of consolidation before make a lunge for $1525. Gold has a tendency to sudden price collapse. The correction from here on may not be very orderly.
|
| |
 |
Silver: Silver closed the week at 28.95. Silver has been consolidating just above 28 before it attempts to take out the $26 level. Odds are that the $26 level will not hold and the metal is destined to a deeper support towards $20. Like gold, the plunge could come ant time; in fact as early as next week or two.
|
| |
 |
HG Copper: Copper closed the week at 3.5090. Copper has a strong support at 3.40 followed by a deeper one at 3.25. Copper has already violated both its 200 and 50 DMAs. It is unlikely to rally from 3.40 and could plunge much further in line with other commodities. The upward sloping trend line on the chart above is unlikely to hold.
|
| |
 |
WTI Crude: WTI crude closed the week at $91.95. Crude has been consolidating just above its 200 DMA at $90. It is the strongest commodity on the charts but the odds of its escaping the general commodity correction are slim if only from the cash flow crunch spillover effect. Crude could however continue to hover above $ 90 but below $95 for a few weeks more before it too heads for $84 level.
|
| |
 |
CRB CCI: The CRB CCI commodity index closed at 552 after having made a low of 543 and violating its floor at 550. The index is unlikely to have ended it correction and may consolidate for a while above 550 support before attempting a retest of its key support at 450. In terms of wave counts and time, it has plenty of room to get there.
|
| |
 |
NASDAQ 100: Bear Trap. The chart above best illustrates the bear trap laid for early bears that will now fuel this market rally. Note, the large inverted S-H-S on the charts. NASDAQ 100 collapsed on cue at the right shoulder at 2780. However, it turned around from 2690, just above the index’s 200 DMA and negated the right shoulder trapping bears who did not wait for the pattern to confirm. NASDAQ is replete with frontline stocks like IBM, MSFT, AAPL, INTC, AMZN that have been correcting for months and could rally further. Expect short covering to fuel this rally further.
|
| |
 |
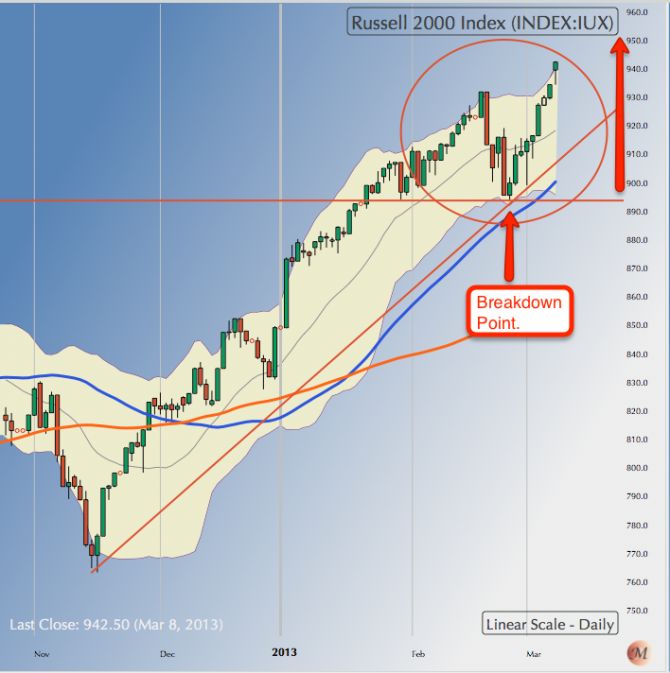
Russell 2000: Bear Trap. Russell 2000 represent another kind of bear trap set for early bears. The index broke support at 895 that it should not have setting off fears that the correction from the top of 932 would broaden into a full-fledged rout. However, the break was not confirmed and the Index has rallied from the “breakdown” point & gone on to make a new. Both Russell 2000 and NASDAQ 100 are par for the course in a topping process as bear traps. Both have given a new lease of life to the rally.
|
| |
 |
S&P 500 [SPX]: SPX closed the week at 1551, not far from its all time high of 1576. The real debate is now of how much higher in price & further in time this rally can go. I have mentioned earlier that this rally can extend into May in terms of wave counts. It doesn’t have to. But if there are enough trapped bears, especially those geniuses that were long commodities and short equities, [and there were many such critters who thot no end of themselves] then this rally may well go parabolic from here! Not calling a top!
|
| |
 |
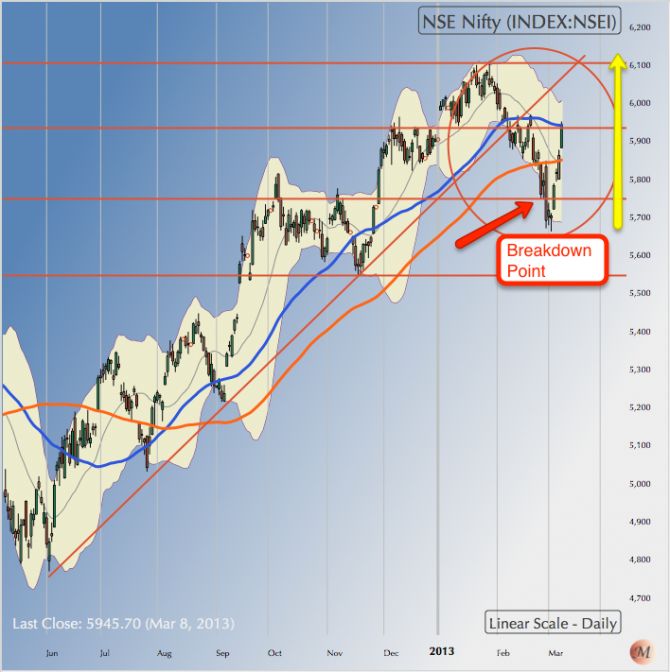
NSE NIFTY: Nifty rallied sharply from its support at 5700 to close the week at 5945.70 more or less at its 50 DMA. NIFTY is well above its 200 DMA. NIFTY cannot escape the gyrations in the world equity markets even as it marches to its own rhythm. The real question is how far in price & time can this rally go.
NIFTY is in the process of completing its last leg of correction for the excesses of 2007 and building the base for a new bull market that will probably unfold after 2014 elections. Between now and end of this year, NIFTY has to raise a credible bull flag, a process that is now underway and then correct for the rally from 4540 to 6300 [assuming this rally gets to 6300].
What will be the contour of such a move? My sense it that NIFTY will continue this rally much like that in the US to some time in May end making a high in the vicinity of 6300 and then correct till the elections of 2014. The correction that follows the May top needn’t be sharp or make a new low. And not all sectors will do it together.
Within this overall picture, expect the NIFTY to decently rally from here on to middle/end May. The strength of the rally from here will tell us something about the next long term bull market to unfold in 2014.
|
| |
NB: These notes are just personal musings on the world market trends as a sort of reminder to me on what I thought of them at a particular point in time. They are not predictions and none should rely on them for any investment decisions.
Sonali Ranade is a trader in the international markets


