 Gold [$GOLD]: Gold continues in its complex correction and is currently compressing between $1530 on the downside and $1660 on the upside. As mentioned last week gold has the potential to test its 200 DMA area currently centered on $1660 and even nick it, thereby triggering a "breakout". However, the wave counts indicate such a breakout, while possible, would be false and the downtrend would resume shortly thereafter.
Gold closed last week at $1603 after making a low of $1586 which is its 50 DMA. Expect gold to drift slowly towards the $1660 area over the ensuing week. However, in the intermediate term, the correction in the metal has some time to run and is far from over. Note, however, that the charts indicate substantial short-covering is taking place around $1550. Not bullish on the metal.
 Silver [$SILVER]: As mentioned last week, silver is in an orderly pullback mode and should drift towards the target of $31 in the next few months, albeit with fairly sharp corrections on the way. Silver made a high of $28.4 last week, corrected down sharply to $26.94 and then closed the week at $27.10. Expect similar jerky drift over the next few months towards $31. Unless you are a compulsive trader, better to stay away from the metal over the next few months.
WTI Crude [$WTIC]: Crude made a high of $92.94 the week before last, had an orderly correction down to $87 and then spiked up on Friday to close last week at $91.40. Crude's price action after the low of $77.28 on June 28 is very bullish.
 Crude's 200 DMA is in the $94 area. Over the next week, expect crude to pierce through its $92 resistance to challenge $94 and the 200 DMA. While not expecting a breakout at the first attempt, I continue to be bullish on crude. On a break above $92, expect crude to consolidate between $90 and $94 for a while before moving up again.
Once crude breaks atop its 200 DMA convincingly, the slight hope that still animates India bulls will be squelched as the government continues to dither on petroleum price pass through. The Government of India has been subsisting on curious brand of "hopium" since 2004 when crude prices took off. Eight years of dithering has not taught it any lessons on the futility of hoping for reduction in crude prices. Wonder when it will wake up to the new normal in commodity prices and debasement of the dollar.
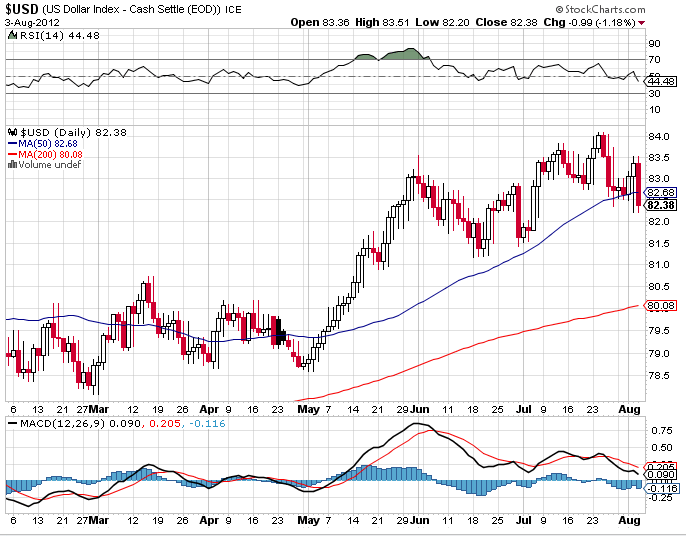 Dollar Index [$USD]: As mentioned last week, the dollar is in correction and consolidation mode after a very long bullish run. After having made a top of 84.2646 the week before last, the index moved down to close last week at 82.46 with sharp corrections in between. Expect similar jerky driftdown to continue in the ensuing week with the ultimate target of 81. Not bearish on the dollar in the long-term. What we are seeing is a short-term correction in a normal bullish uptrend.
Incidentally, the Dollar Index 50 DMA is in the 82.50 area while 200 DMA is approaching the 81 area. Both could offer support to the correcting index.
Euro$ [FXE]: As mentioned in the last post, the Euro found an intermediate term bottom at 1.2040 on July 24 and is in a pullback from there. This 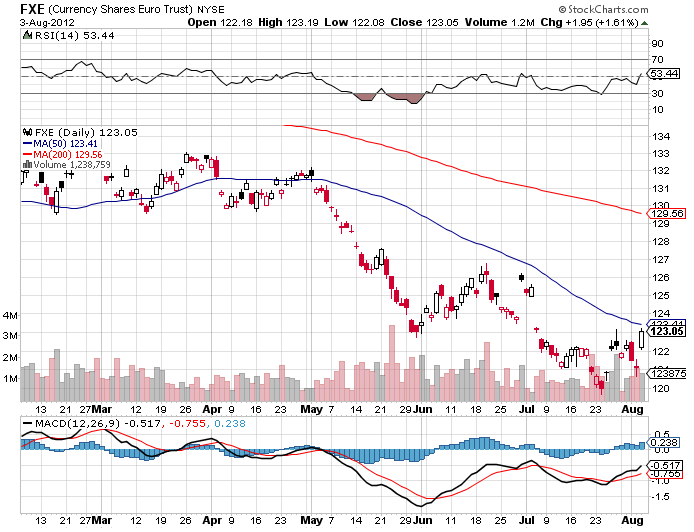 upward correction in the Euro may continue for a while. During the week, Euro made a high of 1.24 and then corrected sharply down to 1.2132 before closing the week at 1.2385.
With this we can say that the bottom of 1.20 was retested during last week and the Euro held ground well above it. A break above 1.24, the next resistance level will see the Euro aim for 1.2750 the next major resistance, albeit with sharp corrections on the way. Barring corrections, expect a fairly strong upward bias in the value of the Euro over the next few weeks.
$-INR: I was expecting the $ to come down and retest the R54 region before moving up again. However, the $ made a low of R54.18 on July 3 and followed that up with a series of higher tops and bottoms without really testing the R54 region again. That could be interpreted as a bullish sign but I am not very comfortable with that interpretation.
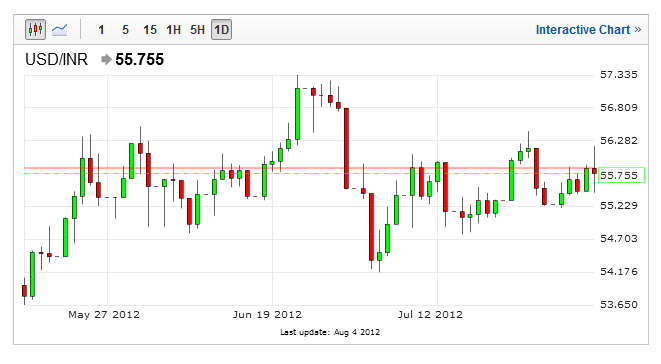 Nevertheless, in terms of wave counts and time, we have run out of room for a correction down to the R54 region. In the ensuing week the $ could drift up against the Rupee. The first target on the upside is 56.50 followed by the previous top at 57.50. While not expecting a new high at the first attempt, the possibility does exist. Don't be short the dollar in the Indian market in the near term. Whether or not the $ goes parabolic against will be know only after the $ retests the 57.50 region.
S&P 500 [SPX]: The S&P 500 continued its incredible 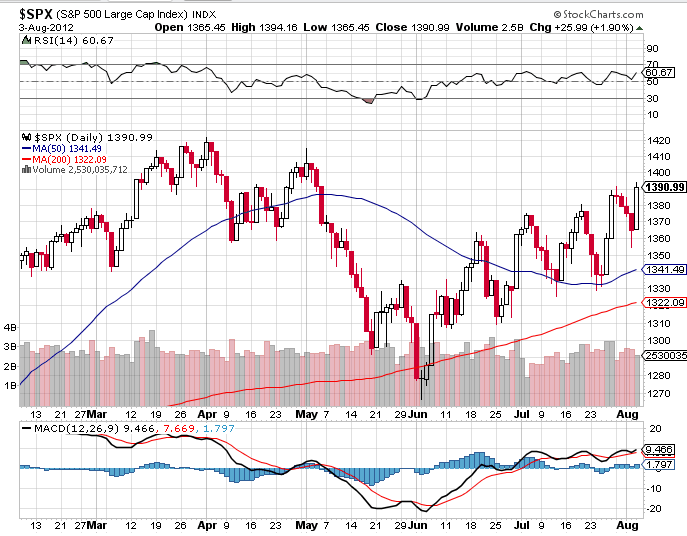 gravity defying act last week making unexpected highs despite sharp corrections. The index closed at 1390.99 last week, not far from its previous top at 1422.65. The index has multiple resistances between 1390 and 1420, the first being at 1400 and the next at 1410. The possibility of the index taking a shy at its previous top can't be ruled out. Whether it can sustain a break atop 1420 is a different matter.
It is hard to be bullish at this stage in the rally, especially given the sharp corrections and jerky nature of the pullback. I would rather wait for the market to decide which way it wants to go as it attempts to regain the previous high. My bias would be to sell at the top of the rally if it fails to make a new high over the next two weeks. Mind, the market could turn down on a dime from here. Note also that volumes have not favored the up moves and have been decidedly heavier in falling markets.
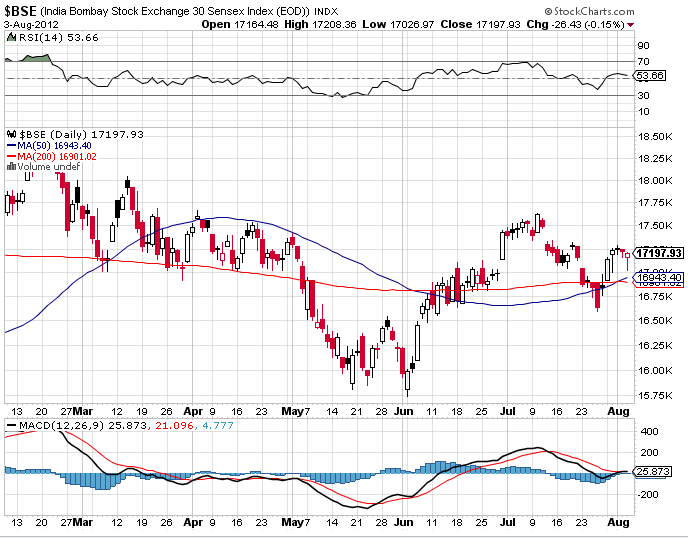 Sensex: After making a low of 16,586 on July 26, the index pulled back to 17,292 before falling again. The index should continue to drift down with the first target at 16.500 followed by the 15,500 region. If we are close to a true end of the correction in the Sensex, the index should accelerate its down-trend from here as the destructive tail end of the last impulse wave takes hold. We have seen no evidence of that happening so far.
While one must recognise that we are towards the end of a long bearish trend, there is little evidence of the capitulation that is necessary for a confirmation to the end. The next few weeks are crucial for a full capitulation without which it is hard to end such a long bearish spell that we have had.
NB: These notes are just personal musings on the world market trends as a sort of reminder to me on what I thought of them at a particular point in time. They are not predictions and none should rely on them for any investment decisions.


