Investors should use the rally to clear the garbage and create a cash cushion. Correction in the mid-cap space could be very brutal, says Sonali Ranade
Markets keep making new highs amid all the talk of over-valuations, credit bubbles and currency debasement. We are in very mature bull markets, which can turn on a dime. There is never any need for real investors to call a top or a bottom. Only fools and traders indulge themselves in such stupid exercises. For the rest, it is easy to see we pretty much within five per cent of a near term top in US markets. Taking out the garbage from the portfolio to buy into a correction is the prudent strategy.
NIFTY will not be immune to a sharp correction in the US and world markets. And while Asian markets like Shanghai and Nikkei are in strong uptrends, they are close to near-term overhead resistances. The tricky part therefore is to determine if any reasoned estimate of the likely correction can be made.
Having cycled through all the 50 NIFTY charts, my impression is that the ensuing correction will be very shallow and short and not a market crash.
It is not my intention to go into the construction of bull and bear traps. But when you are expecting a shallow correction you need both to turn a profit. And the obvious violation of 5950 so close to a top makes me very vary of both.
Investors should use the rally to clear the garbage and create a cash cushion. Correction in the mid-cap space could be very brutal.
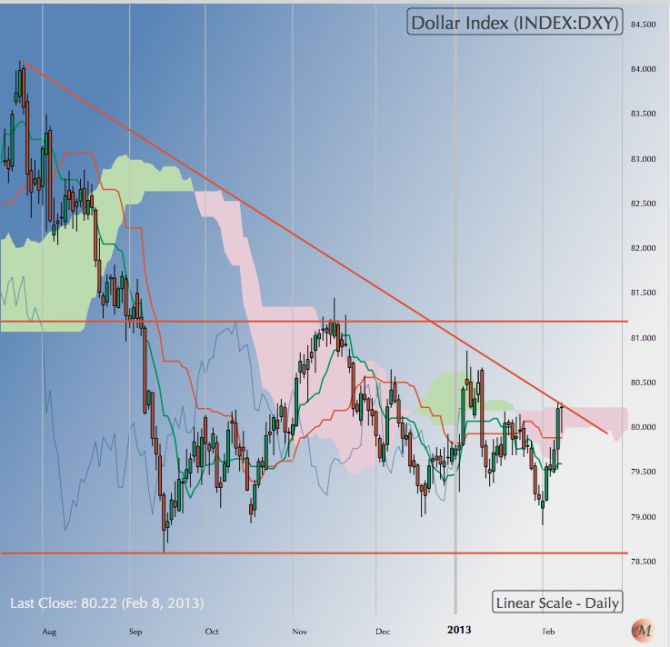 |
US Dollar [DXY]: Dollar closed the week at 80.3160, testing the upper end of its trading range defined by the down-sloping trend line from the top of 84.2450 back in July 2012.
Is the correction over? I think there is another leg down to the correction, perhaps the last, and it could be violent. One could see a final bottom in the Dollar for this correction in the third week of March around 79.
|
| |
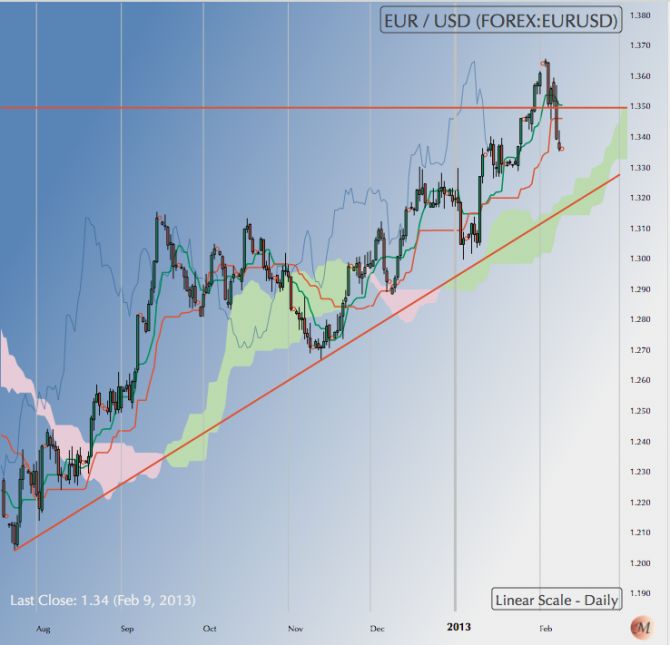 |
EURUSD: Euro pair closed the week at 1.3363 well below the floor at 1.34. While the correction was expected, a violation of the floor at 1.34 indicates that this correction could last for a while. Barring pullbacks, the first target for the Euro is now 1.326 followed by the rising trend line from the base of the current rally. I think we will see a pullback to 1.35 before the Euro seeks lower levels.
|
| |
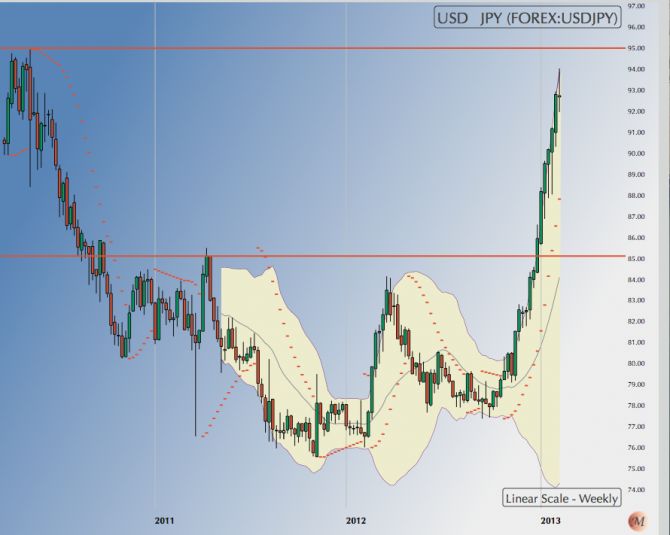 |
USDJPY: The dollar closed at Yen 92.66. No prizes for guessing where it is headed.
If as expected we see some base building just below the 95 level through a sideways correction, we may see a further rally to 100 by the middle of March. Else the dollar needs to correct for quite some time for the ripping rally against the yen.
The next week or two will tell us where the dollar is headed against the yen. In terms of time there is room for 95 but not quite 100.
|
| |
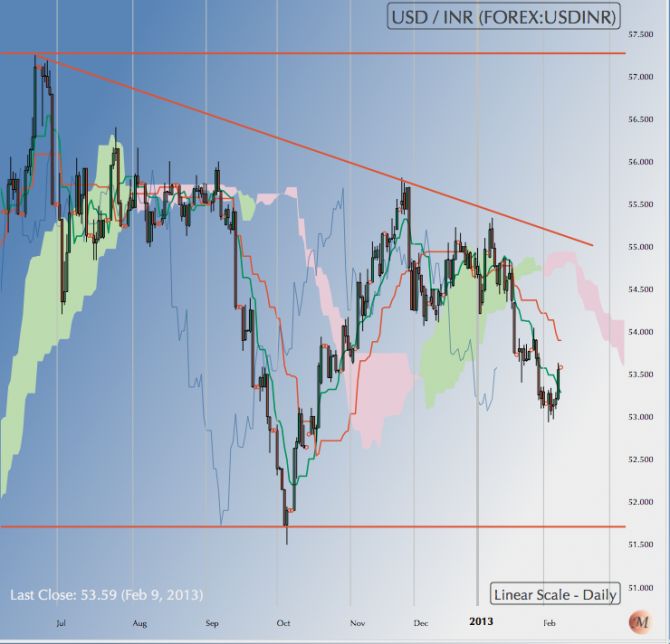 |
USDINR: The dollar closed the week at 53.58. The spike up from 52.88 looks reactive and we can expect the downtrend to resume shortly. Maintain my view that the dollar is headed towards a retest of the floor at 51.50 by end of March.
A fall below INR 51.50 looks unlikely for the moment. That said, we are in Wave III down here.
|
| |
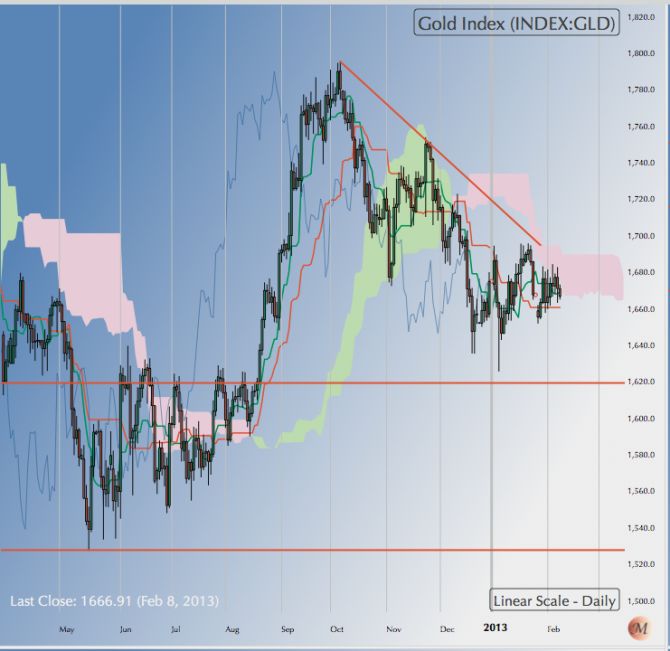 |
Gold: Gold closed the week at $1666.90. Gold could possibly trend up to test the top of the trading range defined by the down sloping trend line and even nick to get to 1680-1700 range. But it would be a deceptive move.
In the longer time frame, gold is all set to test $1620 followed by $1525.
|
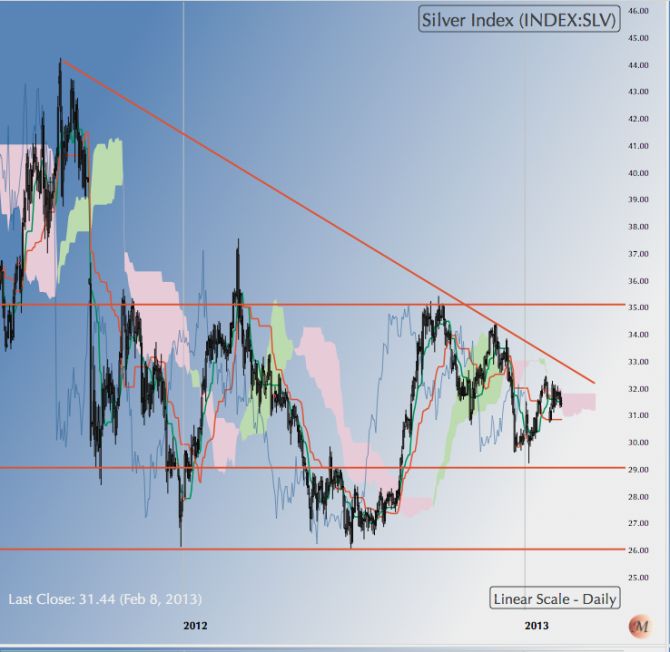 |
Silver: Silver remains an unmitigated disaster on the charts, closing the week at 31.44. But it might have a trick or two up its sleeve. Firstly, silver is headed down to retest $28.50, meaning the immediate trend continues to be down. The trick could come in the form a bear rally from $28.50 or a wee bit higher after March. Treacherous territory ahead. Note, silver is just under its 50 DMA and well above its 200 DMA.
|
| |
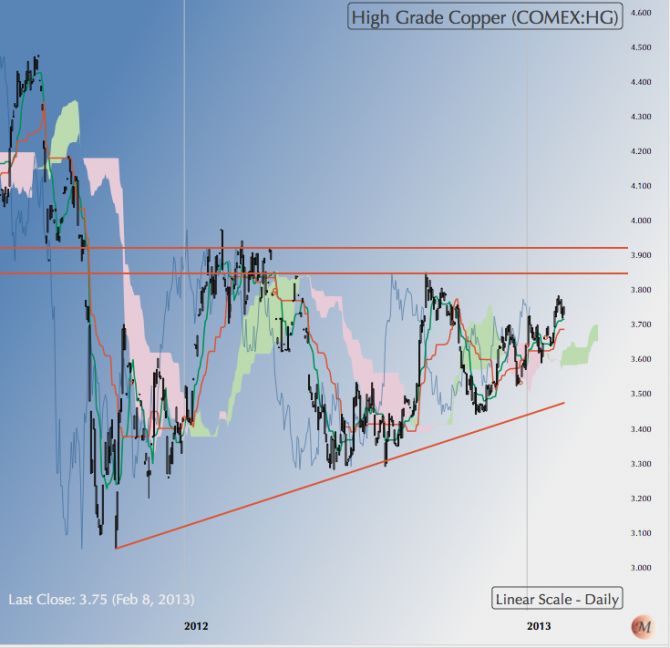 |
HG Copper: HG copper closed the week at 3.7950.
Copper came back to test the floor at 3.72 before attempting an assault on the major overhead resistance of 3.84. Until copper decisively clears 3.84, there is both time and space to come back to 3.10 like other metals. So the test of 3.84 over the next few weeks is key.
|
| |
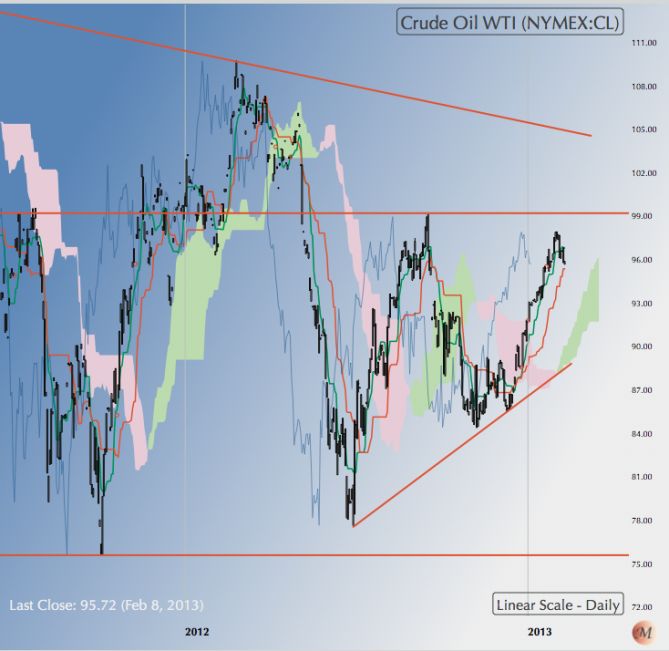 |
WTI Crude: Crude closed the week at $95.72, turning down from just below its overhead resistance at $98.
Crude has a support at $94.50, which could be tested over the next week before crude mounts another assault on $98 overhead. Failure to take out $98 decisively could see crude coming back to test is 200 DMA again especially other risk assets correct.
|
| |
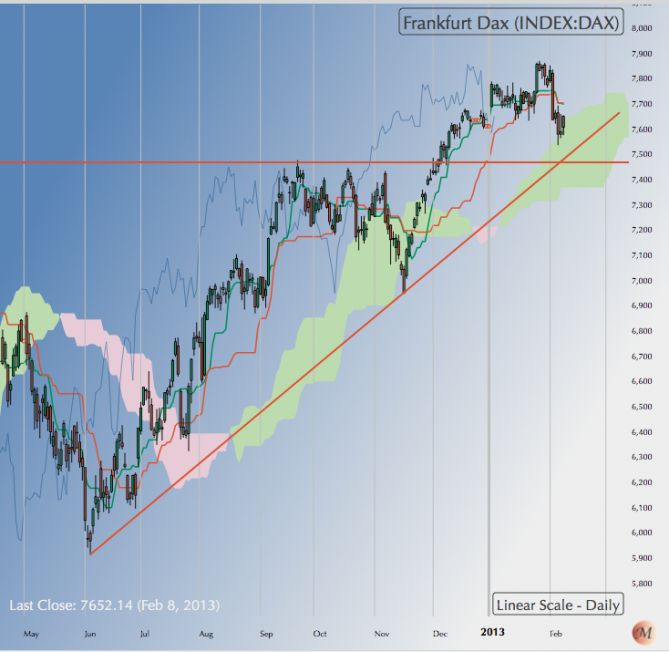 |
DAX: DAX closed the week at 7652.14. DAX is the strongest index in the EU and it is a whisker away from a crucial floor at 7450, a violation of which could trigger a deluge of sell orders. In terms of time it is two weeks away, may be less, from an important date line that could terminate this leg of the rally. Do we see a violation of 7450 or 8100?
As a trader that is an academic issue. I would go 0:0 and wait for confirmation to short. As an investor I would clean out the garbage and a bit to create cash to buy lower. Note, the correction will be shallow.
|
| |
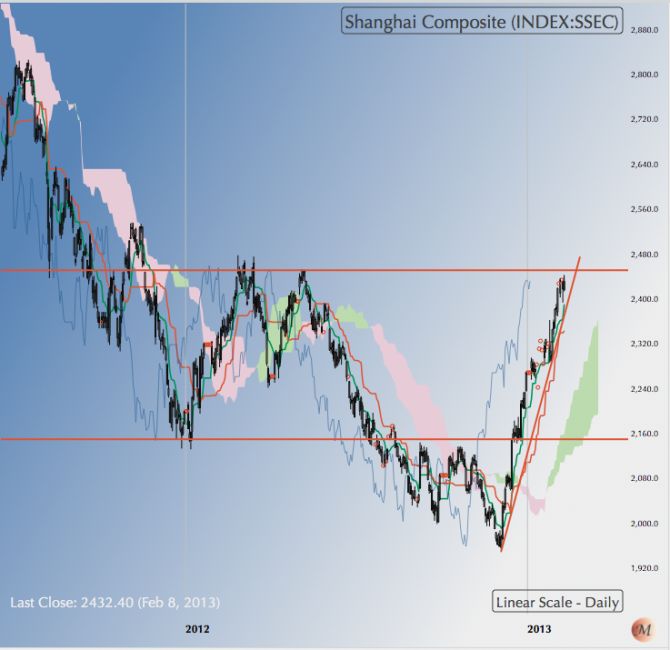 |
Shanghai Composite: No prizes for this one. Nick or not, a correction down to the 200 DMA from the 2500 region is overdue. It could be sharp, very sharp. The Chinese overplay on price.
|
| |
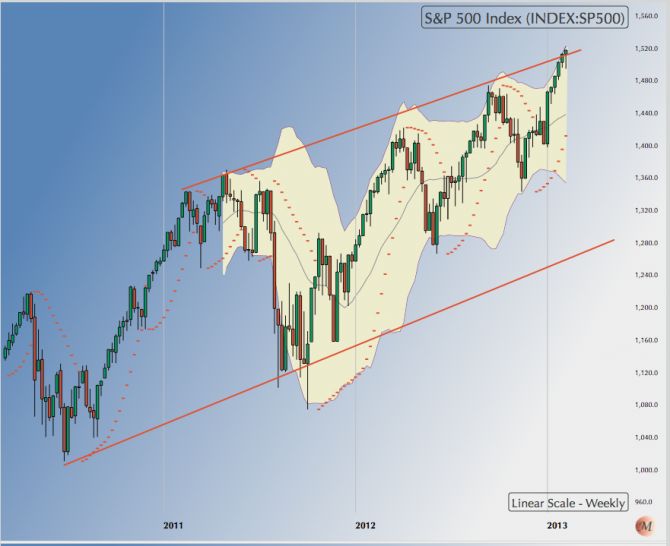 |
S&P 500 [SPX]: SPX closed the week at 1517.93. Much like the DAX it is a week or two away from a very important date line that could terminate the rally. In terms of price, SPX has already achieved its target and there is no earthly reason why SPX needs to make a new high before going into a correction. So take out the garbage and hold only the blue-chip long-term stuff.
The correction that follows won’t be sharp or brutal. It will be shallow and keep bull hopes alive. But values in the mid-cap space could take a severe beating. But that’s par for the course.
|
| |
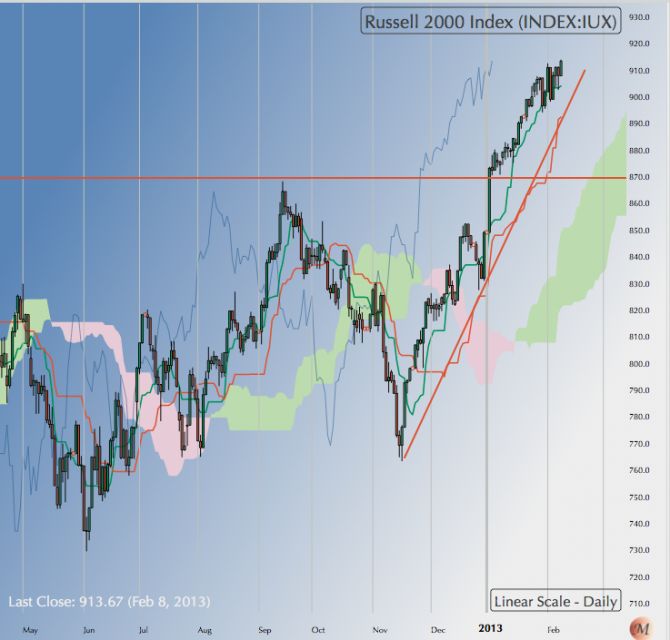 |
Russel 2000 [RUT]: RUT closed the week at 913.67, a lifetime high over the previous top 870 in April 2011 and well over 6.89 pc higher than the 2007 bull market top. Compared to SPX, that quite an outperformance.
RUT could aim for 950. It has about three to four weeks to make it there. But whether it will, I cannot say. Both, the parabolic run-up and the outperformance in mid-caps vs large caps says to take out the garbage. Mid-cap corrections can be brutal and uncivilised.
|
| |
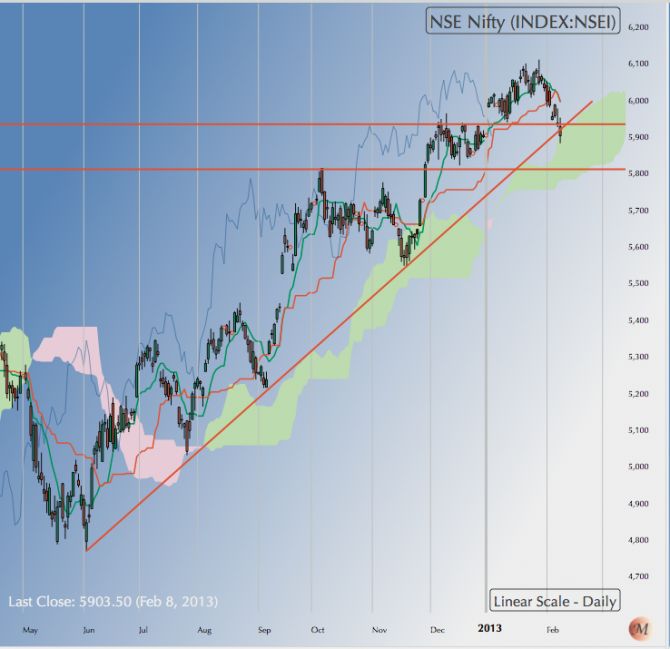 |
NIFTY: NIFTY broke the 5950 support on a retest and closed the week 5903.50. The break is not decisive but it is not isolated either. At the very least it puts up all the cautionary signals of an impending correction.
There are many scenarios for the ensuing correction and I can’t go into all of them. But several points can be made. Firstly about 50 pc of the major stocks in the NIFTY, and I cycled through all of them chart by chart, are close to their support levels or deep into a correction already. They can’t crash the market from such low levels.
Of the sectors ripe for a correction, only two stand out. FMCG including the cigarette giant and branded pharmaceuticals have outperformed the index right since the crash of 2007 and look ripe for correction. The IT sector could correct a bit. Can these sectors crash the markets? Short answer is no. So I am of the view that we are headed into a correction but it will not be anything like we have seen before.
Could the index pullback from 5800 or near about and go on to make a new high before correcting? Very much so. In fact that is the scenario I favour given the devious way in which we can construct both bear & bull traps!
Clear the garbage but stick to your blue chips for a while longer!
|
NB: These notes are just personal musings on the world market trends as a sort of reminder to me on what I thought of them at a particular point in time. They are not predictions and none should rely on them for any investment decisions.
Sonali Ranade is a trader in the international markets


