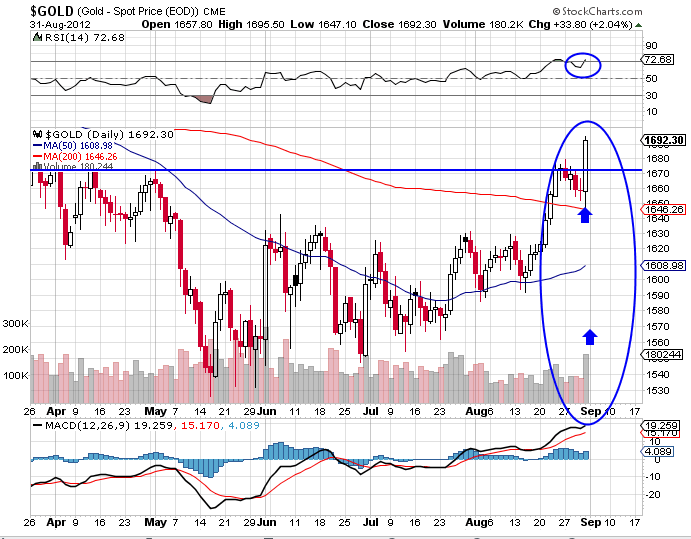
 Gold [$GOLD]: By any technical standard, the breakout in gold price last week was impressive. Gold had corrected down from $1670 to $1640, just above its 200 DMA and then shot up to $1692.30, well past its overhead resistance at $1670. The breakout was accompanied by a high traded volume in overbought conditions which makes the breakout all the more noteworthy.
It would be churlish to disregard such impressive price action. However, the breakout comes at point where one would expect it in terms of wave counts. We will not know if the breakout is just a reactive pullback or the real thing for another two weeks or so. I would not rush to buy the breakout unless the price sustains well over $1640 for some time to come. Respect the breakout but treat it with more than ordinary caution.
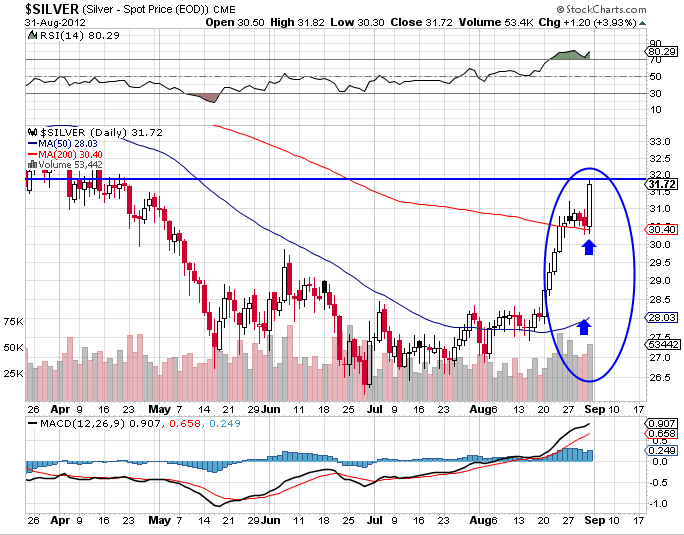
Silver [$SILVER]: As discussed last week, silver has followed completely different trajectory from the one followed by gold in this correction. In the case of silver, a rally to the topside [$30 to $35 region] could have been expected if silver were in a long term bear market. Silver's break above its 200 DMA is impressive and the price could rally further. The price may sustain over $30 for quite some time albeit with corrections. However, in the case of silver, the breakout is not likely to signal a new bull run. I am far more sceptical of the Silver breakout than the one in gold.
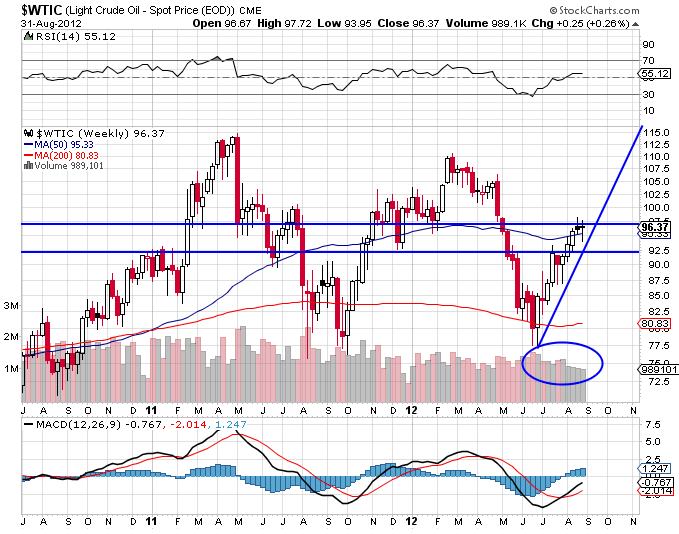
WTI Crude [$WTIC]: As expected crude continued to correct, testing its 200 DMA and the current rally's baseline. Crude closed the week at $96.47 a shade below its 200 DMA. The correction could continue in the ensuing weeks. Note, the rally in crude on weekly charts hasn't been supported by increasing volumes. Unless traded volumes pick up, an early resumption of the rally in crude shouldn't be expected. I am not bearish in crude though I expect it to spend some time in the $90-$95 region before resuming the uptrend again.
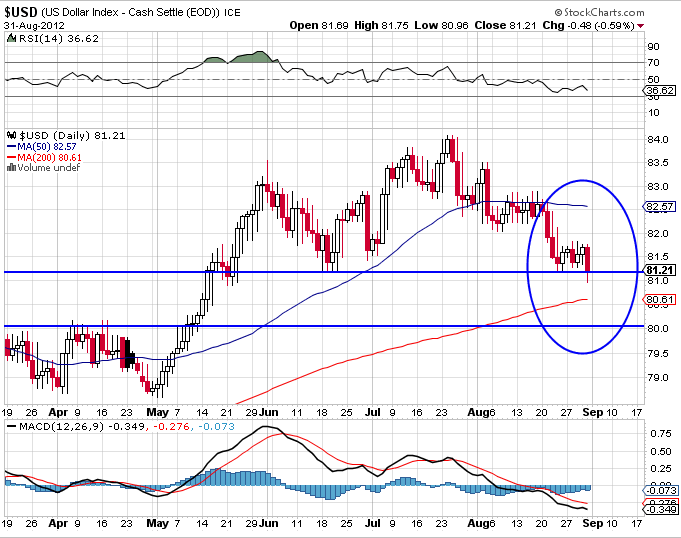
US Dollar [$USD]: As expected the mighty dollar continued to correct, closing the week at 81.22. The dollar is likely to test its 200 DMA area between 80 and 81 in the next two weeks. I expect the 200 DMA to be respected and a bounce from that region back to 82/83. But that's a few weeks away.
Long-term, while the dollar is correcting, the uptrend from 73 is still intact and will resume once the correction is over. So I am not bearish on the dollar. This scenario will be invalidated if the dollar seriously breaks below its 200 DMA.
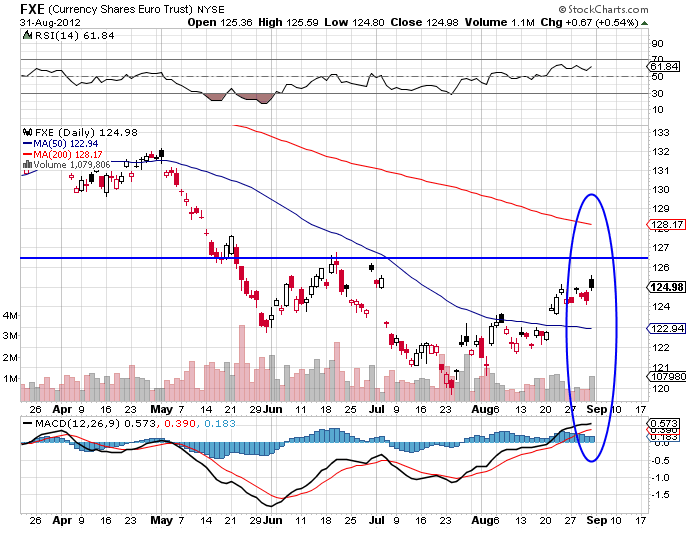
Euro$ [FXE]: As expected, the euro continued to rally against the $, closing the week at 1.2575
Long-term, the case for a continuing rally in the euro$ is uncertain. We would know the long-term trend only on a correction following the current rally. Look for opportunities to sell rally peeks over the next two weeks.
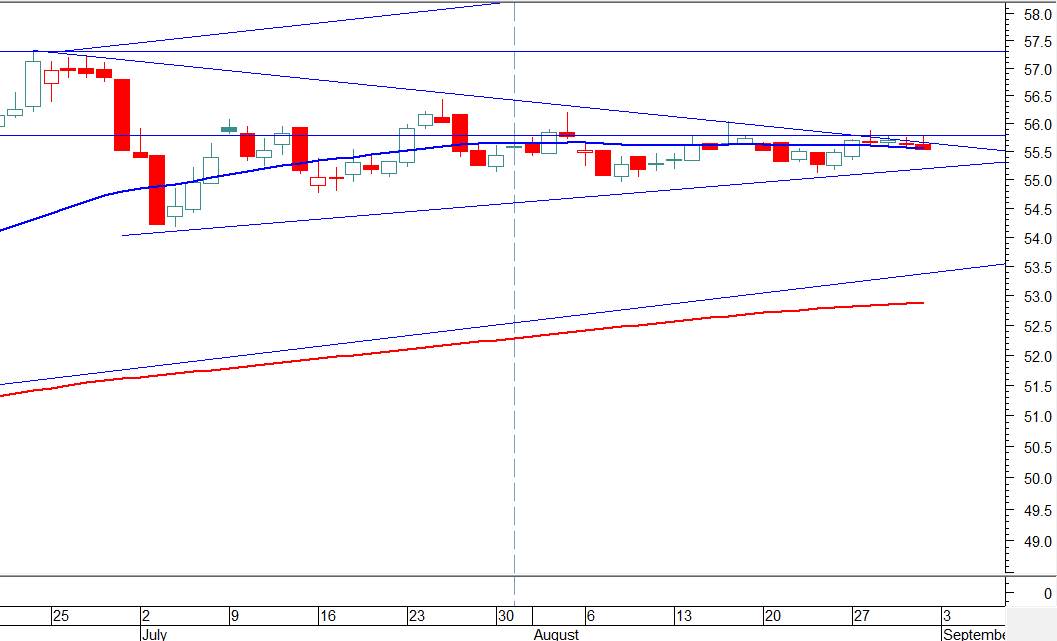
$-INR: I was expecting a breakout of the contracting triangle shown above during the week. That did not happen but then it could happen in the ensuing week. As is obvious from the chart, the $ has to breakout from the triangle one way or the other and the wave counts favor a breakout to the topside.
A breakout to the topside should invite a retest of the previous top. Not bearish on the dollar against the rupee.
 NYSE Composite: Note the indecisive Doji on Friday after the great speech by Bernanke promising of QE3. Is that all the bulls could do? Amen!
In my opinion the downtrend underway in the broad market is likely continue, never mind the trumped up gyrations in the SPX. The downtrend could take us to 7860 region over the next two to three weeks. The crucial level to watch out for is 7900. Support for the index at that level could offer clues to where it is headed.
Increasingly, it is clear that asset prices are being propped up by central banks. The last time this was done led to a full-fledged disaster in the form of an asset bubble leaving the system itself crippled. There is insufficient evidence if any lessons have been learned.
Sensex:
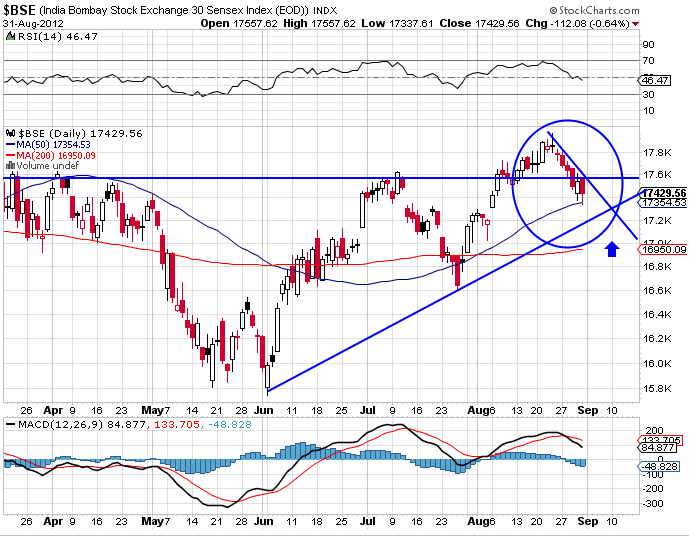
The Sensex is in a well established downtrend. Having crossed below the 17,600 mark, it rose on Thursday to observe the level as overhead resistance and fell away from there on Friday to close the week at 17.430.
The downtrend will continue to test the 17,200 level which is the first region of support. I would be surprised if that floor held for a long. The Indian equity markets need to correct for a lot of macro-level factors.
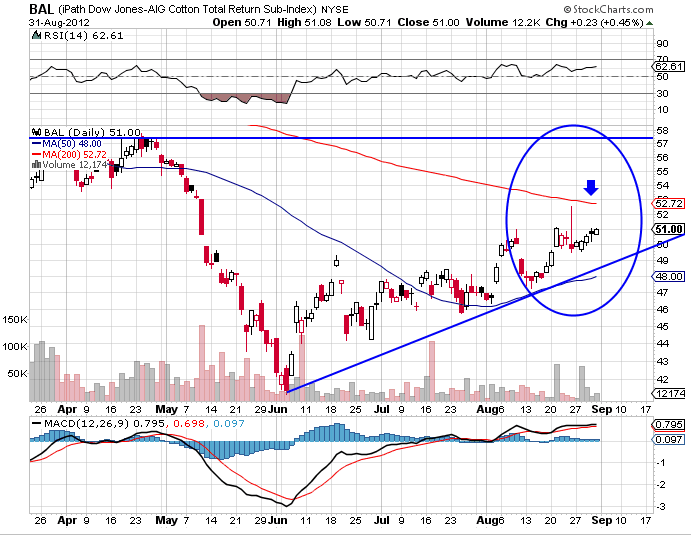
Cotton: The chart shows the Dow Jones-AIG Cotton Total Return sub-index and is a good proxy for cotton. In my last blog post on agricultural commodities I had pointed out that cotton was the lone commodity readying itself for a bull-run. The above chart is supportive of that notion.
The index is positioned at 51 just under its 200 DMA at 53. Prices are well above the 50 DMA. On break above 53, cotton will have confirmed a new bullish uptrend. Previous experience shows this could last a few years and go a long distance. That should enable our farmers to take advantage of it.
NB: These notes are just personal musings on the world market trends as a sort of reminder to me on what I thought of them at a particular point in time. They are not predictions and none should rely on them for any investment decisions.
Sonali Ranade is a trader in the international markets
