Questions will be raised over why those changes take place and whether non-economic factors are at play, says A K Bhattacharya.

India's gross domestic product (GDP) numbers, released recently, surprised most analysts.
The economy grew at 8.4 per cent in the third quarter (October-December) -- a six-quarter high -- and the second advance estimate (SAE) for 2023-24 placed GDP growth at 7.6 per cent, up sharply from the first advance estimate (FAE) of 7.3 per cent.
The primary reason for the increase in the SAE for 2023-24 was a downward revision in the GDP growth for 2022-23, from 7.2 per cent to 7 per cent.
The spurt in net indirect tax collections, too, must have boosted not just the October-December quarter growth but also the annual growth number.
The surprise in the 2023-24 growth numbers, however, may not end here.
Remember that this is an election year. General elections to the 18th Lok Sabha will be held in April and May.
Though a rising growth curve before the general elections will indeed help bolster the ruling party's image of having steered the economy well, the key question is whether that growth curve will be maintained in subsequent revisions of the GDP number after the general elections are over.
For an answer, watch out for the provisional estimate of growth for 2023-24, to be released on May 31.
Meanwhile, a study of how GDP data revisions took place in 2019, when the last general elections were held, could be instructive.
The puzzle of FY19
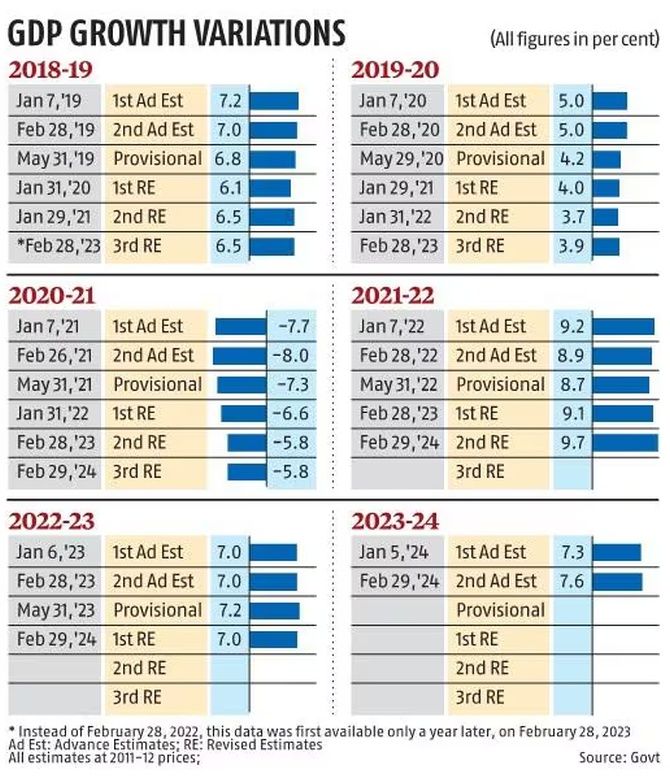
On January 7, 2019, the National Statistical Office (NSO) released the FAE of India's GDP for 2018-19, which placed the growth in real terms at 7.2 per cent.
This data was released about three-four months before the general elections were due to be held.
What did the SAE of India's GDP growth for 2018-19 say? The SAE, released about two months later, on February 28, 2019, reduced the growth number to 7 per cent.
The scaling down was largely due to an upward revision for the 2017-18 GDP growth number from 6.7 per cent to 7.2 per cent.
The base effect was at work. The previous year's growth number had gone up and hence the growth for 2018-19 had to be revised down.
But what happened to the next few iterations of the 2018-19 growth numbers is puzzling.
The general elections in 2019 were held between April 11 and May 19. The first GDP print for 2018-19, released after the general elections, was called Provisional Estimate, or PE. And the PE for GDP growth in 2018-19 was revised down to 6.8 per cent.
Not only that, in the subsequent three iterations, ending with the final estimate called the Third Revised Estimate, the GDP growth in 2018-19 was reduced to 6.5 per cent.
There was no higher base effect at work, either. On the contrary, the GDP numbers for 2017-18 were being revised downwards.
From the first print of 7.2 per cent to the final estimate of 6.5 per cent, the journey of downward revisions, therefore, was stark.

Down in FY09, up in FY14
Even while estimating the GDP growth for 2008-09, also a general election year, a sharp variation was noticeable.
In its advance estimate for 2008-09, released on February 9, 2009, the growth in GDP at market prices was placed at 7.1 per cent.
This data release took place before the general elections, which were held between April 16 and May 13 of 2009.
About a year later, the quick estimate, released on February 8, 2010, placed the growth rate for GDP at market prices at 5.1 per cent.
That decline could be attributed to the failure of the NSO in accurately estimating the likely impact of the global financial meltdown on the Indian economy's performance. But what cannot be ignored is that the first GDP print for 2008-09 came out weeks before the elections were to be held.
The GDP number for 2013-14, another general election year, saw no such downward revision in its different iterations.
On the contrary, the growth number for GDP at market prices had to be revised upward after the general elections in April-May 2014.
In February 2014, the advance estimate for 2013-14 growth in GDP at market prices was placed at 4.6 per cent, but the provisional numbers, released after the elections in May 2014, placed it at 5 per cent.
It could be argued that the sharp variations in GDP data have taken place not just during election years.
Indeed, such instances have become more noticeable in recent years, after the base year was changed to 2011-22.
For instance, in 2016-17, the GDP number, according to the FAE, was 7.1 per cent, but the Third Revised Estimate placed it at 8.3 per cent. The following year did not witness such a sharp variation.
But the three years that followed saw the sharpest variations.
The difference between the first estimate of growth and the final estimate was about a percentage point of GDP in 2018-19. But the variation in the growth numbers for 2019-20 was sharper, when it swung from 5 per cent, as measured by the FAE, to 3.9 per cent in the final estimate, or the Third Revised Estimate.
Again, in 2020-21, the year of contraction in the wake of the Covid pandemic, the growth rates differed sharply: From an FAE of -7.7 per cent to the Third Revised Estimate of -5.8 per cent.
It would appear that the variations in crisis years are sharper.
Experts in national income data collection point out that variations take place because the early iterations rely mostly on numbers obtained from the organised sector and it is only in the later iterations that the unorganised sector data gets reflected in the GDP numbers.
Thus, in a crisis year, the poorer performance of the unorganised sector becomes a bigger drag on the economy.
These are valid explanations. But when an election year also experiences such sharp variations in GDP numbers, questions will be raised over why those changes take place and whether non-economic factors are at play.
Such speculation can be scotched only if the government fixes whatever remaining weaknesses that continue to plague the country's GDP data collections system.
Feature Presentation: Rajesh Alva/Rediff.com


