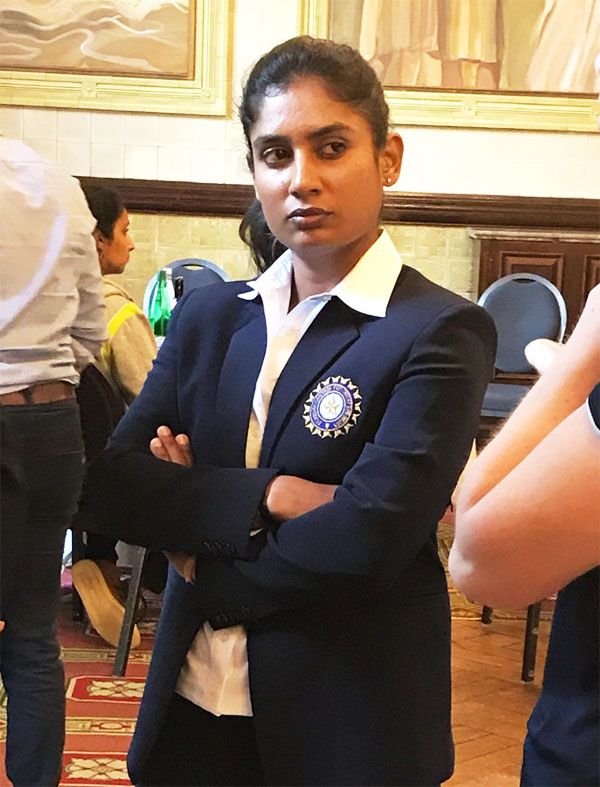
Mithali Raj made cricketing history last week.
Rajneesh Gupta tells us why.

Mithali Raj, the Indian women team's cricket captain, became the leading run-scorer in women's One-day Internationals during her innings of 69 against Australia in the ICC Women's ODI World Cup, surpassing England's Charlotte Edwards.
A glimpse of Mithali's awe-inspiring ODI career:
Career highlights
- Made her ODI debut at the age of 16 years, 205 days vs Ireland in 1999.
- Scored 114* on ODI debut -- the highest score by an Indian on debut and second highest by any player in this format at that time.
- Mithali at 16 years, 205 days is still the youngest to score a hundred in women's ODIs.
- Played 74 consecutive innings between 2000 and 2007 without scoring a duck -- the longest streak for any player at that time (since broken by Australia's Karen Rolton).
- Played 109 consecutive matches between 2004 and 2013 -- the longest streak for any player in women's ODIs.
- Has a career span of over 18 years -- the longest for an Indian player in this format.
- Scored seven fifties on the trot this year -- the most any player has ever scored in consecutive innings in this format.
- Has batted at every position from number 1 to 9 in women's ODIs.
- Led India for the first time in 2004 vs the West Indies at the age of 21 years, 94 days to become the youngest captain for India in this format.
- Led India in 106 ODIs winning 65 and losing 38 with three no result games (a win percentage of 61.32)
- Has won 18 Woman of the Match awards -- the second most in women's ODIs after the West Indies' Stafanie Taylor (20). Among the Indians no one else has won more than six!
Performance against each opponent
| Matches | Runs | Highest Score | Average | 100s | 50s | |
| England | 48 | 1,605 | 98 | 48.63 | 0 | 16 |
| Sri Lanka | 25 | 926 | 108* | 154.33 | 2 | 7 |
| Australia | 30 | 896 | 89 | 34.46 | 0 | 7 |
| New Zealand | 26 | 817 | 91* | 38.90 | 0 | 5 |
| West Indies | 18 | 616 | 109* | 51.33 | 1 | 3 |
| South Africa | 14 | 447 | 69* | 44.70 | 0 | 6 |
| Ireland | 10 | 335 | 114* | 111.66 | 1 | 2 |
| Pakistan | 10 | 262 | 103* | 52.40 | 1 | 1 |
| Bangladesh | 1 | 73 | 73* | - | 0 | 1 |
| The Netherlands | 1 | 51 | 51 | 51.00 | 0 | 1 |
Performance in each country
| Matches | Runs | Highest Score | Average | 100s | 50s | |
| in India | 71 | 2,323 | 109* | 55.30 | 3 | 15 |
| in England | 35 | 1,187 | 114* | 43.96 | 1 | 10 |
| in Australia | 18 | 580 | 89 | 38.66 | 0 | 5 |
| in New Zealand | 15 | 541 | 98 | 41.61 | 0 | 4 |
| in Sri Lanka | 15 | 521 | 73* | 104.20 | 0 | 6 |
| in South Africa | 17 | 469 | 91* | 58.62 | 0 | 6 |
| in Pakistan | 5 | 165 | 108* | 165.00 | 1 | 0 |
| in Ireland | 4 | 157 | 66 | 52.33 | 0 | 2 |
| in West Indies | 3 | 85 | 57 | 28.33 | 0 | 1 |
Performance at home and away
| Matches | Runs | Highest Score | Average | 100s | 50s | |
| Home | 71 | 2,323 | 109* | 55.30 | 3 | 15 |
| Away | 69 | 2,248 | 94* | 44.07 | 0 | 22 |
| at Neutral venues | 43 | 1,457 | 114* | 60.70 | 2 | 12 |
Performance in each calendar year
| Year | Matches | Runs | Highest Score | Average | 100s | 50s |
| 1999 | 3 | 118 | 114* | 59.00 | 1 | 0 |
| 2000 | 3 | 152 | 69* | 76.00 | 0 | 2 |
| 2002 | 15 | 323 | 61 | 29.36 | 0 | 1 |
| 2003 | 12 | 497 | 98 | 45.18 | 0 | 3 |
| 2004 | 15 | 539 | 88 | 77.00 | 0 | 5 |
| 2005 | 15 | 300 | 91* | 42.85 | 0 | 3 |
| 2006 | 23 | 684 | 108* | 45.60 | 1 | 5 |
| 2007 | 7 | 163 | 55 | 27.16 | 0 | 1 |
| 2008 | 15 | 526 | 74 | 52.60 | 0 | 6 |
| 2009 | 7 | 247 | 75* | 61.75 | 0 | 2 |
| 2010 | 5 | 287 | 91* | 143.50 | 0 | 4 |
| 2011 | 9 | 240 | 109* | 30.00 | 1 | 0 |
| 2012 | 12 | 414 | 94* | 51.75 | 0 | 4 |
| 2013 | 4 | 132 | 103* | 66.00 | 1 | 0 |
| 2014 | 8 | 266 | 104* | 53.20 | 1 | 0 |
| 2015 | 5 | 141 | 81* | 47.00 | 0 | 1 |
| 2016 | 9 | 378 | 89 | 63.00 | 0 | 3 |
| 2017 | 16 | 621 | 73* | 77.62 | 0 | 9 |
Performance as a player and a captain
| Matches | Runs | Highest Score | Average | 100s | 50s | |
| as a player | 77 | 2,486 | 114* | 45.20 | 2 | 17 |
| as Captain | 106 | 3,542 | 108* | 57.12 | 3 | 32 |
Batting first and second
| Innings | Runs | Highest Score | Average | 100s | 50s | |
| 1st match innings | 90 | 3,295 | 114* | 43.93 | 4 | 28 |
| 2nd match innings | 74 | 2,733 | 103* | 65.07 | 1 | 21 |
Performance in won and lost matches
| Matches | Runs | Highest Score | Average | 100s | 50s | |
| Won match | 105 | 3,786 | 114* | 75.72 | 5 | 30 |
| Lost match | 74 | 2,242 | 98 | 33.46 | 0 | 19 |
| No result | 4 | - | - | - | - | - |
Performance at each batting position
| Matches | Runs | Highest Score | Average | 100s | 50s | |
| Opener | 6 | 305 | 114* | 101.66 | 2 | 0 |
| 3rd position | 81 | 3,311 | 109* | 54.27 | 3 | 30 |
| 4th position | 67 | 2,207 | 91* | 45.97 | 0 | 18 |
| 5th position | 6 | 181 | 53* | 45.25 | 0 | 1 |
| 6th position | 1 | 3 | 3* | - | 0 | 0 |
| 8th position | 2 | 9 | 8 | 9.00 | 0 | 0 |
| 9th position | 1 | 12 | 12* | - | 0 | 0 |
Leading run-scorers in Women's ODIs
| Matches | Runs | Highest Score | Average | 100s | 50s | |
| Mithali Raj | 183 | 6,028 | 114* | 51.52 | 5 | 49 |
| Charlotte Edwards (England) | 191 | 5,992 | 173* | 38.16 | 9 | 46 |
| Belinda Clark (Australia) | 118 | 4,844 | 229* | 47.49 | 5 | 30 |
| Karen Rolton (Australia) | 141 | 4,814 | 154* | 48.14 | 8 | 33 |
| Claire Taylor (England) | 126 | 4,101 | 156* | 40.20 | 8 | 23 |
| Debbie Hockley (New Zealand) | 118 | 4,064 | 117 | 41.89 | 4 | 34 |
| Stafanie Taylor (West Indies) | 104 | 3,911 | 171 | 43.45 | 5 | 27 |
| Suzie Bates (New Zealand) | 103 | 3,733 | 168 | 42.90 | 8 | 23 |
| Sarah Taylor (England) | 107 | 3,558 | 147 | 40.89 | 6 | 17 |
| Alex Blackwell (Austalia) | 139 | 3,257 | 114 | 35.02 | 3 | 23 |
| Amy Satterthwaite (New Zealand) | 100 | 3,142 | 137* | 38.79 | 6 | 16 |
Leading run-scorers for India in women's ODIs
| Matches | Runs | Highest Score | Average | 100s | 50s | |
| Mithali Raj | 183 | 6,028 | 114* | 51.52 | 5 | 49 |
| Anjum Chopra | 127 | 2,856 | 100 | 31.38 | 1 | 18 |
| Jaya Sharma | 77 | 2,091 | 138* | 30.75 | 2 | 14 |
| Harmanpreet Kaur | 75 | 1,743 | 107* | 32.88 | 2 | 8 |
| Anju Jain | 65 | 1,729 | 90 | 29.81 | 0 | 12 |
| Punam Raut | 50 | 1,463 | 109* | 32.51 | 2 | 9 |
| Hemlata Kala | 78 | 1,023 | 65 | 20.87 | 0 | 3 |


