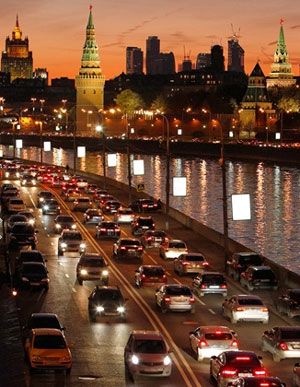
People living in cities are the worst victims of traffic congestion. And their woes just get worse every year.
A traffic index created by TomTom, a navigation and GPS systems manufacturer, lists the cities which bear the brunt of traffic snarls.
For instance, a TomTom's study reveals that drivers in China spend an average of nine working days a year stuck in traffic.
The index measures travel time throughout the day and during peak periods and compares them with travel time during non-congested periods.
The difference is expressed as a total average percentage Congestion level.
The TomTom Traffic Index compares travel time during non-congested hours with travel times in peak hours experienced by passenger vehicles.
Take a look at 10 cities across the world with the worst traffic woes…
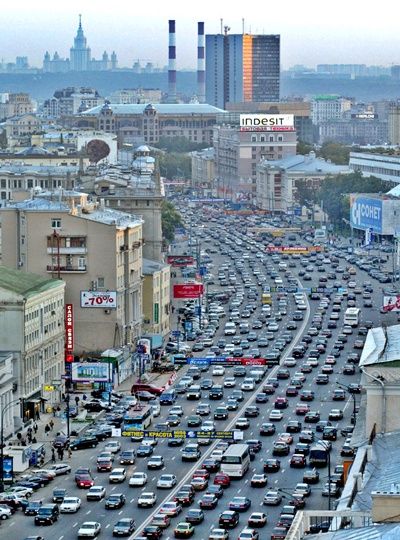
Moscow
Rank: 1
Country: Russia
Congestion level: 74%
Delay per hour driven in peak period: 76 min
Delay per year with a 30 minute travel: 128 hours
Congestion level on highways: 79%
Congestion on non-highways: 72%
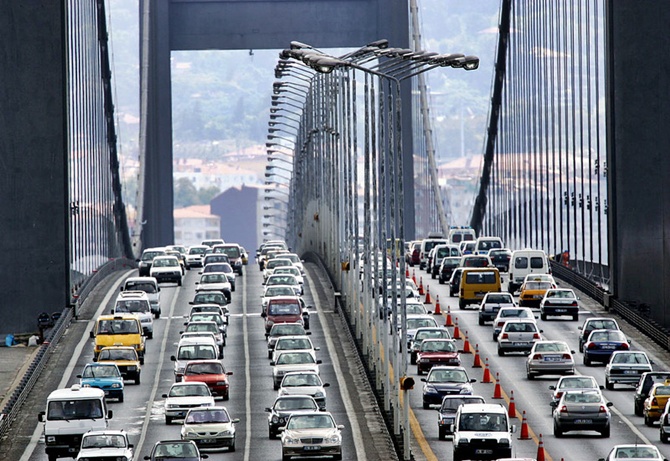
Istanbul
Rank: 2
Country: Turkey
Congestion level: 62%
Delay per hour driven in peak period: 66 minutes
Delay per year with a 30 minute travel: 120 hours
Congestion level on highways: 73%
Congestion on non-highways: 54%
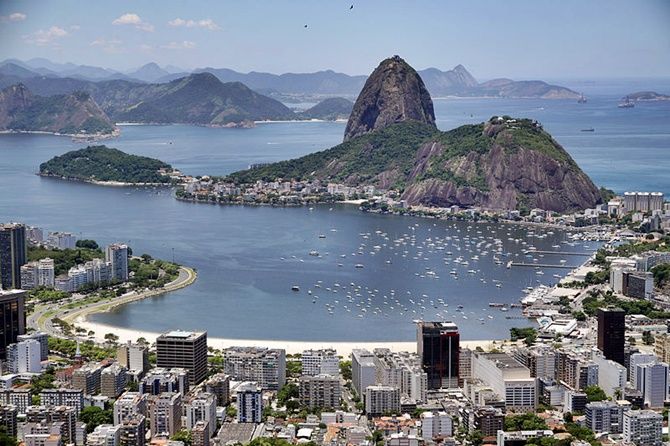
Rio de Janeiro
Rank: 3
Country: Brazil
Congestion level: 55%
Delay per hour driven in peak period: 59 minutes
Delay per year with a 30 minute travel: 114 hours
Congestion level on highways: 45%
Congestion on non-highways: 58%
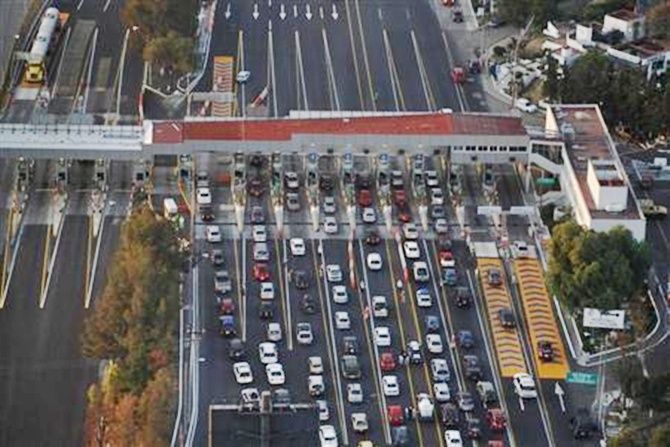
Mexico City
Rank: 4
Congestion level: 54%
Delay per hour driven in peak period: 53 minutes
Delay per year with a 30 minute travel: 107 hours
Congestion level on highways: 43%
Congestion on non-highways: 60%
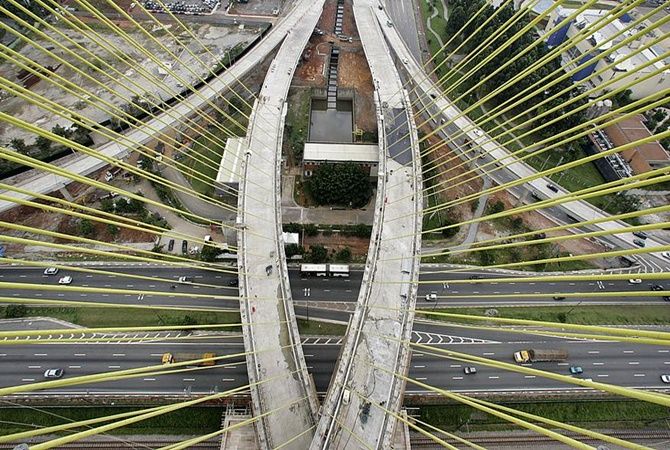
Sao Paulo
Rank: 5
Country: Brazil
Congestion level: 46%
Delay per hour driven in peak period: 48 min
Delay per year with a 30 minute travel: 102 hours
Congestion level on highways: 30%
Congestion on non-highways: 52%

Palermo
Rank: 6
Country: Italy
Congestion level: 39%
Delay per hour driven in peak period: 37 minutes
Delay per year with a 30 minute travel: 87 hours
Congestion level on highways: 29%
Congestion on non-highways: 45%

Warsaw
Rank: 7
Country: Poland
Congestion level: 39%
Delay per hour driven in peak period: 43 minutes
Delay per year with a 30 minute travel: 96 hours
Congestion level on highways: 37%
Congestion on non-highways: 41%

Rome
Rank: 8
Country: Italy
Congestion level: 37%
Delay per hour driven in peak period: 40 minutes
Delay per year with a 30 minute travel: 92 hours
Congestion level on highways: 26%
Congestion on non-highways: 41%
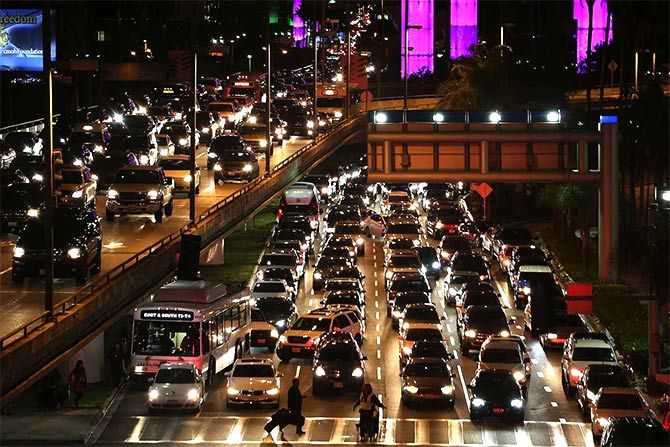
Los Angeles
Rank: 9
Country: United States
Congestion level: 36%
Delay per hour driven in peak period: 39 minutes
Delay per year with a 30 minute travel: 90 hours
Congestion level on highways: 34%
Congestion on non-highways: 38%

Dublin
Rank: 10
Country: Ireland
Congestion level: 35%
Delay per hour driven in peak period: 43 minutes
Delay per year with a 30 minute travel: 96 hours
Congestion level on highways: 27%
Congestion on non-highways: 42%


