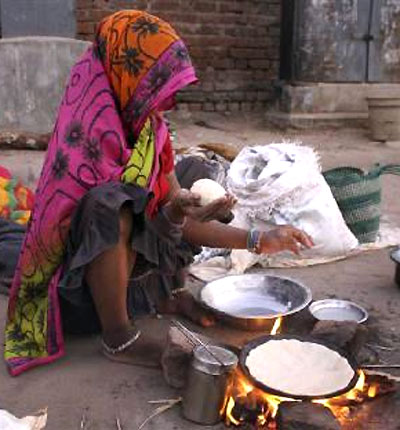
The poverty ratio in the country has declined to 21.9 per cent in 2011-12 from 37.2 per cent in 2004-05 on account of increase in per capita consumption, Planning Commission said.
According to the Commission, in 2011-12 for rural areas, the national poverty line by using the Tendulkar methodology is estimated at Rs 816 per capita per month in villages and Rs 1,000 per capita per month in cities.
This would mean that the persons whose consumption of goods and services exceed Rs 33.33 in cities and Rs 27.20 per capita per day in villages are not poor.
...
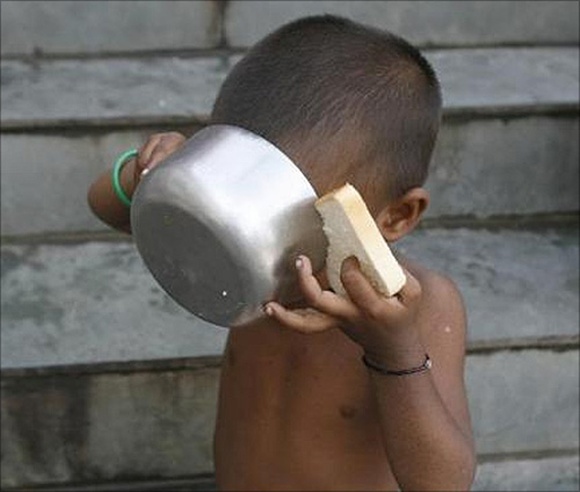
The Commission said that for a family of five, the all India poverty line in terms of consumption expenditure would amount of Rs 4,080 per month in rural areas and Rs 5,000 per month in urban areas. The poverty line however will vary from state to state.
The percentage of persons below poverty line in 2011-12 has been estimated at 25.7 per cent in rural areas, 13.7 per cent in urban areas and 21.9 per cent for the country as a
whole, a Commission's press statement said.
The percentage of persons below poverty line in 2004-05 was 41.8 per cent in rural areas, 25.7 per cent in cities and 37.2 per cent in the country as a whole.
...
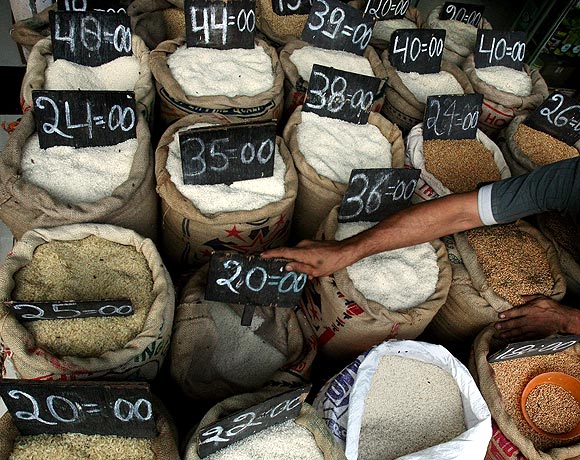
In actual terms, there were 26.93 crore people below poverty line in 2011-12 as compared to 40.71 crore(407.1 million) in 2004-05. This ratio for 2011-12 is based on the methodology suggested by Suresh Tendulkar Committee which factors in money spent on health and education besides calorie intake to fix a poverty line.
The Commission said the decline in poverty is mainly on account of rising real per capita consumption figures which is based on 68th round of National Sample Survey on Household Consumer Expenditure in India in 2011-12.
Earlier, a committee was appointed under Prime Minister's Economic Advisory Council Chairman C Rangarajan to revisit the Tendulkar Committee methodology for tabulating poverty.
The Committee is expected to submit its report by mid 2014.
...
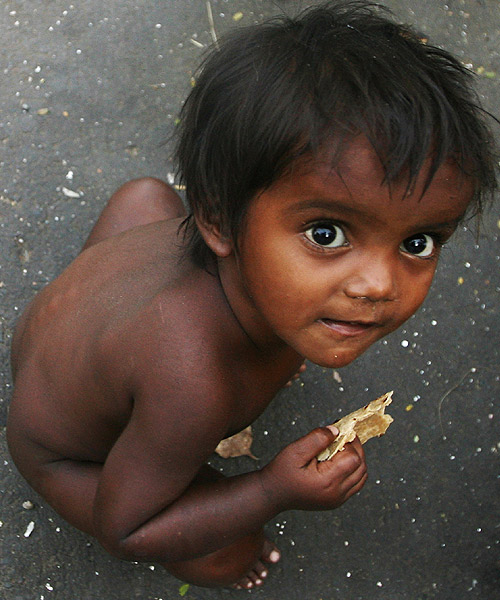
State-wise, the Commission said the poverty ratio was highest in Chhattisgarh at 39.93 per cent followed by Jharkhand (36.96%), Manipur (36.89%), Arunachal Pradesh (34.67%) and Bihar (33.47%).
...
Among the union territories, the Dadra and Nagar Haveli was the highest, with 39.31 per cent people living below poverty line followed by Chandigarh at 21.81 per cent.
...
Goa has the least percentage of people living below poverty line at 5.09 per cent followed by Kerala (7.05%), Himachal Pradesh (8.06%), Sikkim (8.19%), Punjab (8.26%) and Andhra Pradesh (9.20%).