
Photographs: Reuters
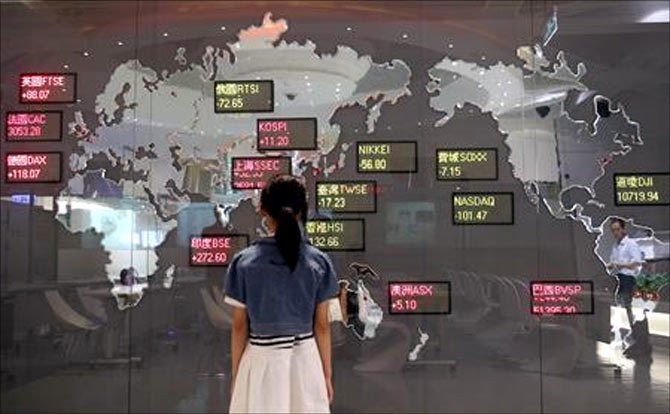
The Indian market is the second worst performing, followed by Brazil, among major global markets so far in 2013.
Both nations' performance in dollar terms is even worse, thanks to a more than 15 per cent slide in their respective currencies against the dollar.
Take a look at the world’s worst performing markets…
…
Indian market among world's worst performers

Photographs: Nacho Doce/Reuters
Bovespa (Brazil)
Index level: 51,429
Performance between January 1 to Aug 27
Local currency: -15.6%
In dollar terms: -28.3%
(Data: Bloomberg)
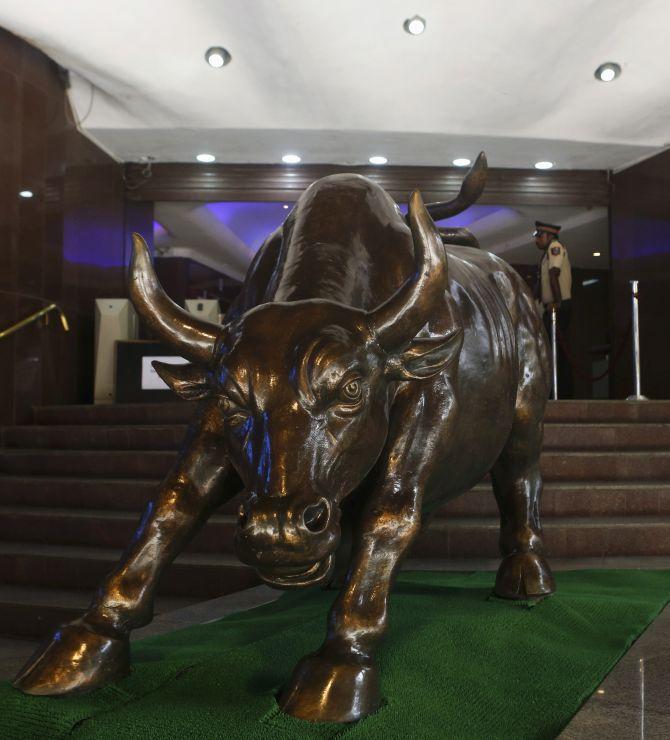
Indian market among world's worst performers
Photographs: Danish Siddiqui/Reuters
Nifty (India)
Index level: 5,287
Performance between January 1 to Aug 27
Local currency: -10.5%
In dollar terms: -24.8%
…
Indian market among world's worst performers
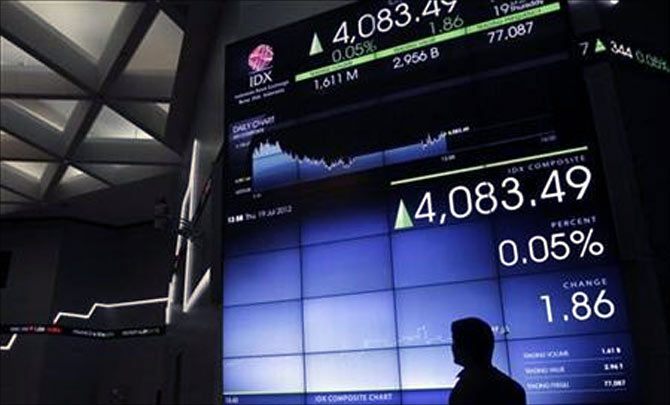
Photographs: Supri/Reuters
Jakarta Composite (Indonesia)
Index level: 3,968
Performance between January 1 to Aug 27
Local currency: -8.1%
In dollar terms: -21.7%
…
Indian market among world's worst performers

Photographs: Reuters
MICEX (Russia)
Index level: 1,374
Performance between January 1 to Aug 27
Local currency: -6.9%
In dollar terms: -14.3%
…
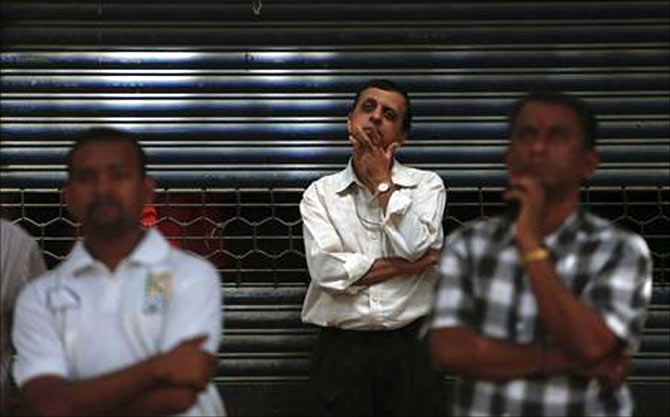
Indian market among world's worst performers
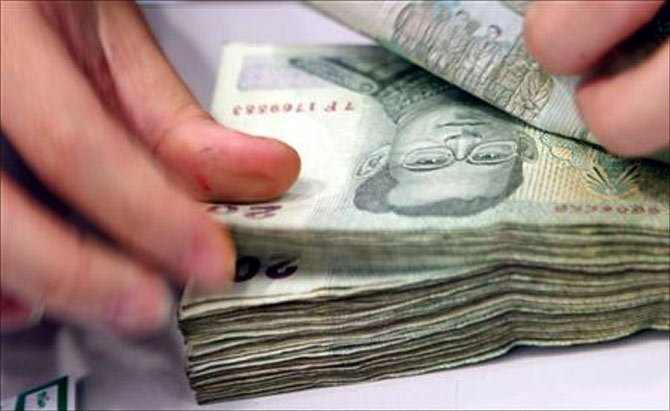
Photographs: Darren Whiteside/Reuters
SE Thai (Thailand)
Index level: 1,294
Performance between January 1 to Aug 27
Local currency: -7.0%
In dollar terms: -11.7%
…
Indian market among world's worst performers
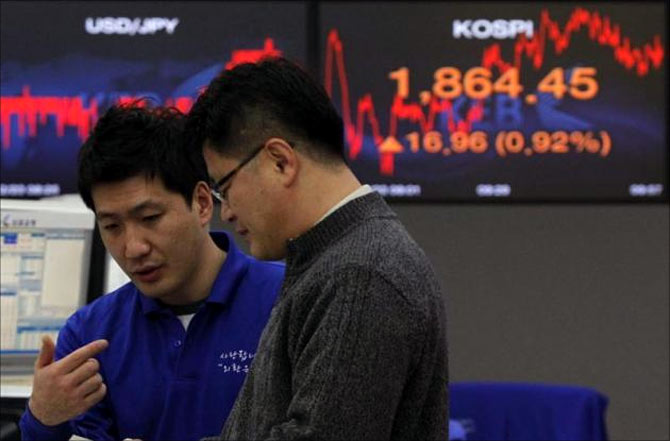
Photographs: Reuters
Kospi (South Korea)
Index level: 1,886
Performance between January 1 to Aug 27
Local currency: -5.6%
In dollar terms: -10.2%
…
Indian market among world's worst performers
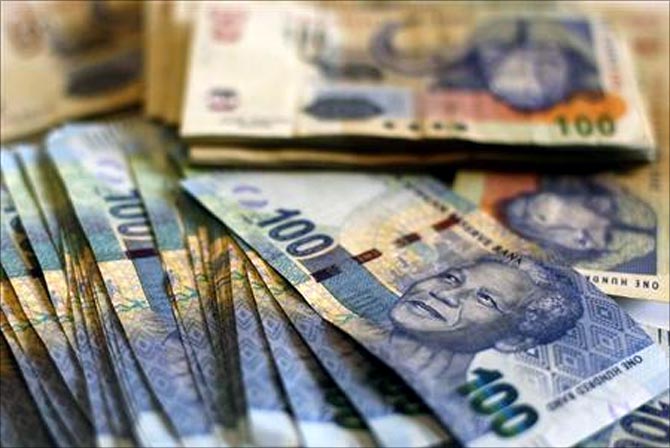
Photographs: Siphiwe Sibeko/Reuters
FTSE T40 (South Africa)
Index level: 38668
Performance between January 1 to Aug 27
Local currency: 11%
In dollar terms: -10.0%
…
Indian market among world's worst performers

Photographs: Tim Chong/Reuters
Straits Times (Singapore)
Index level: 3,034
Performance between January 1 to Aug 27
Local currency: -4.2%
In dollar terms: -9.0%
…
Indian market among world's worst performers

Photographs: Romeo Ranoco/Reuters
PSEi (Philippines)
Index level: 5,920
Performance between January 1 to Aug 27
Local currency: 1.8 %
In dollar terms: -6.3%
…
Indian market among world's worst performers
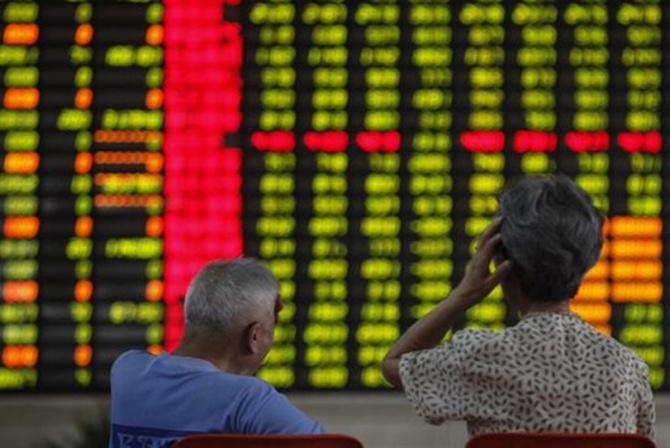
Photographs: Aly Song/Reuters
Shanghai Composite (China)
Index level: 2,103
Performance between January 1 to Aug 27
Local currency: -7.3 %
In dollar terms: -5.6%
…
Indian market among world's worst performers
Photographs: Pichi Chuang/Reuters
Taiex (Taiwan)
Index level: 7,820
Performance between January 1 to Aug 27
Local currency: 1.6 %
In dollar terms: -1.7%

article